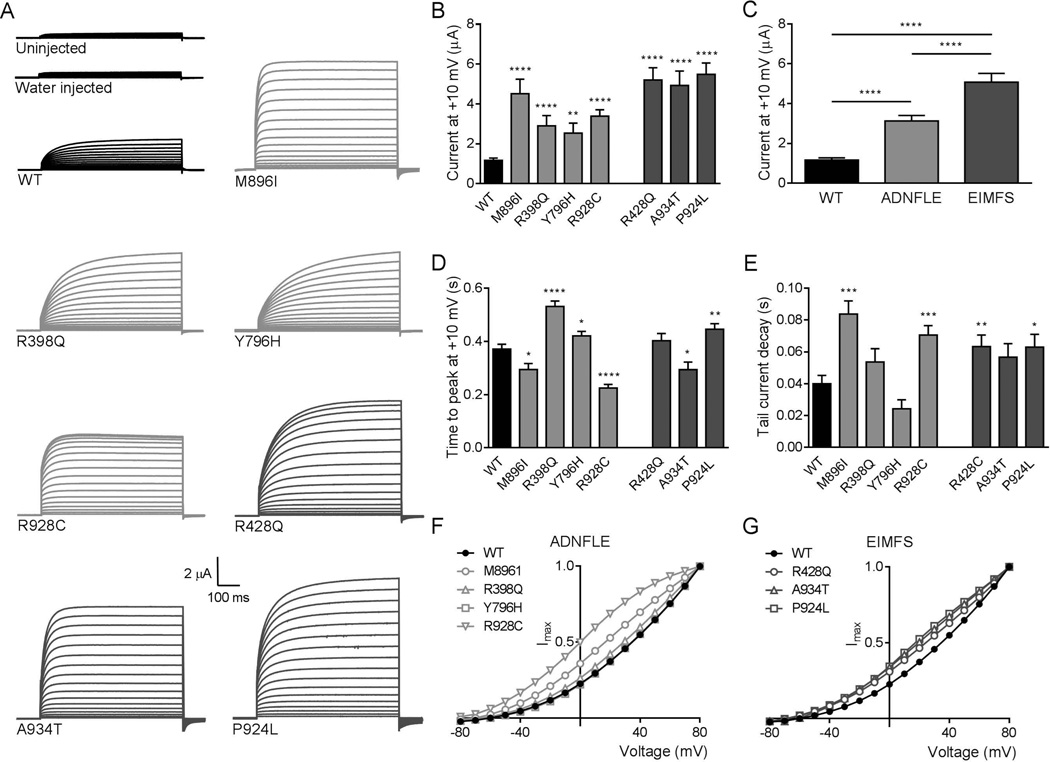
Figure 1.
hKCNT1 wild-type and mutant currents recorded in Xenopus oocytes. (A) Representative current traces obtained from uninjected and water injected oocytes and oocytes expressing wild-type (▬ WT), ADNFLE (▬ M896I, R398Q, Y796H, R928C) and EIMFS (▬ R428Q, A934T and P924L) channels. Oocytes were held at −90 mV and stepped from −80 mV to 80 mV for 600 ms every 5 s. Scale bars apply to all traces. (B) Average peak currents at +10 mV for WT (n=127), M896I (n=39), R398Q (n=41), Y796H (n=63), R928C (n=51), R428Q (n=38), A934T (n=38) and P924L (n=64) channels. The peak currents for each mutant channel at +10 mV were compared to the peak currents for the WT channel at +10 mV. (C) Comparison of pooled currents at +10 mV. WT (■, n=127) and pooled ADNFLE (■, n=194) and pooled EIMFS (■, n=140). (D) Activation kinetics shown as mean time to peak current at +10 mV for WT, M896I, R398Q, Y796H, R928C, R428Q, A934T and P924L channels (see B for n values). The time to peak current for each mutant channel at +10 mV was compared to the time to peak current for the WT channel at +10 mV. (E) Average tail current decay time at +10 mV for WT (n=62), M896I (n=15), R398Q (n=27), Y796H (n=35), R928C (n=40), R428Q (n=36), A934T (n=28) and P924L (n=28) channels. Decay time for each mutant channel was compared to WT. WT (■), ADNFLE (■) and EIMFS (■). (F) Averaged and normalised current-voltage relationships for WT (●, n=127), M896I (○, n=32), R398Q (△, n=37), Y796H (□, n=51), R928C (▽, n=46). (G) Averaged and normalised current-voltage relationships for WT (●, n=127), R428Q (○, n=32), A934T (△, n=34) and P924L (□, n=29) channels. Currents were normalized to the value at a test potential of +80 mV (Imax). (*p< 0.05; **p< 0.01; *** p< 0.001; ****p<0.0001).

