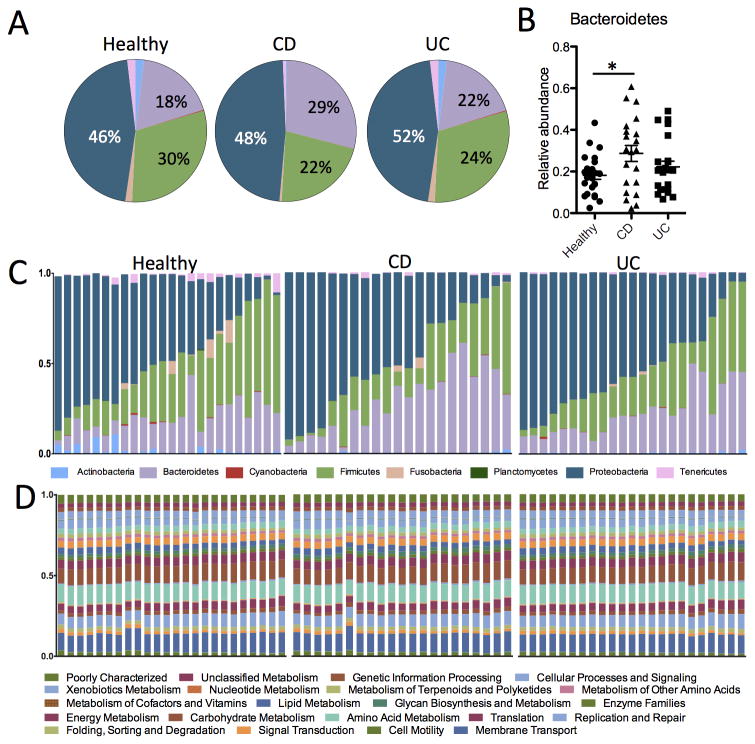
Figure 1. Taxonomic and functional diversity of the mucosal microbiota in IBD and healthy patients.
(A) Pie charts representing the mean relative abundances of the major (>1%) phyla present in the mucosal microbiota from healthy, UC and CD patients. (B) Scatterplot showing significantly higher relative abundance of the Bacteroidetes phyla in biopsies from CD patients (p < 0.05). (C) Stacked bar charts showing the individual variability of the relative abundances of the major bacterial Phyla among individual patients. (D) Relative abundances of metabolic pathways encoded in the mucosal microbiota are evenly distributed and similar across both individuals and disease states.

