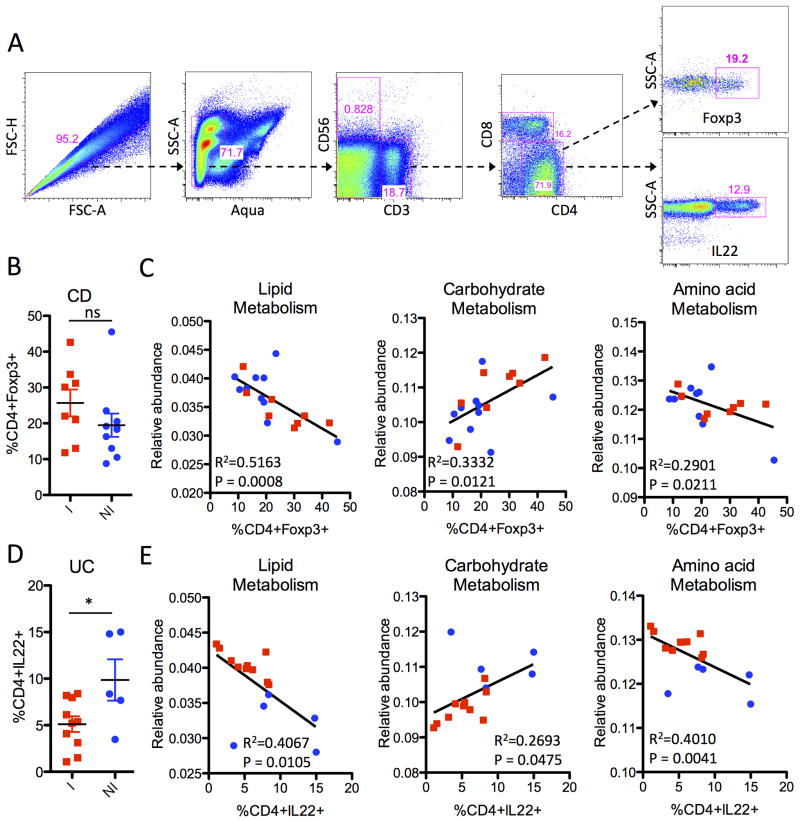
Figure 5. Correlation of microbial function with the homeostasis of CD4+ effector cells.
(A) Representative gating strategy for the FACS analysis of lamina propria mononuclear cells (LPMCs), showing live CD3+ CD4+ lymphocytes with intracellular staining for interleukin (IL)- IL-22 production and Foxp3 expression. (B) Frequency of CD4+Foxp3+Tregs from LPMCs of CD patients in Inflamed (red) and Non-Inflamed (blue) biopsy sites. (C) Linear regression of KEGG pathways (lipid, carbohydrate and amino acid metabolism) with the percentage of CD4+Foxp3+ present in the same biopsy location taken from CD patients. (D) Frequency of CD4+IL-22+ cells of UC patients in Inflamed (red) and Non-Inflamed (blue) biopsy sites. (E) Linear regression of KEGG pathways with the percentage of CD4+IL-22+ cells present in the same biopsy location taken from UC patients.

