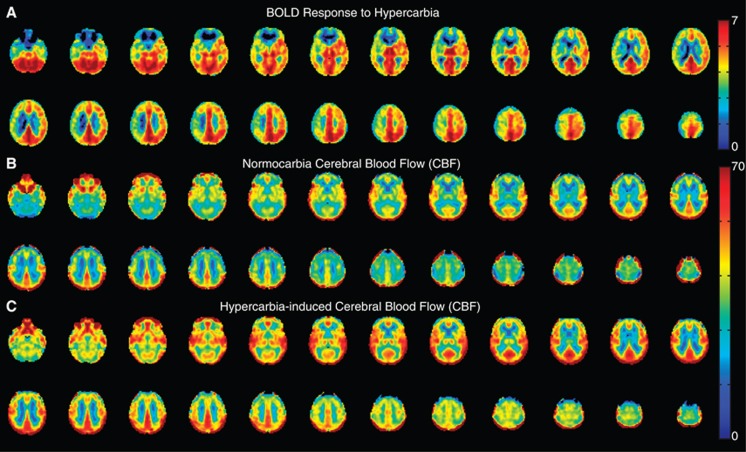
Figure 4.
Mean blood oxygenation level-dependent (BOLD) and cerebral blood flow (CBF)-weighted arterial spin labeling (ASL) responses to hypercarbia in all participants (n=15) exhibiting negative BOLD regions. Data have been co-registered to a 4 mm atlas and grouped such that radiologic right is the side of maximum stenosis or most severe moyamoya disease. Clear asymmetry is seen in the BOLD reactivity maps. While the axial CBF maps clearly increase with hypercarbia, asymmetry is less obvious, suggesting more complex mechanisms underlying the BOLD reactivity maps than can be explained by CBF-weighted ASL alone. The lower asymmetry in the CBF maps could also be because of a difference in bolus arrival time of healthy and ischemic tissue.

