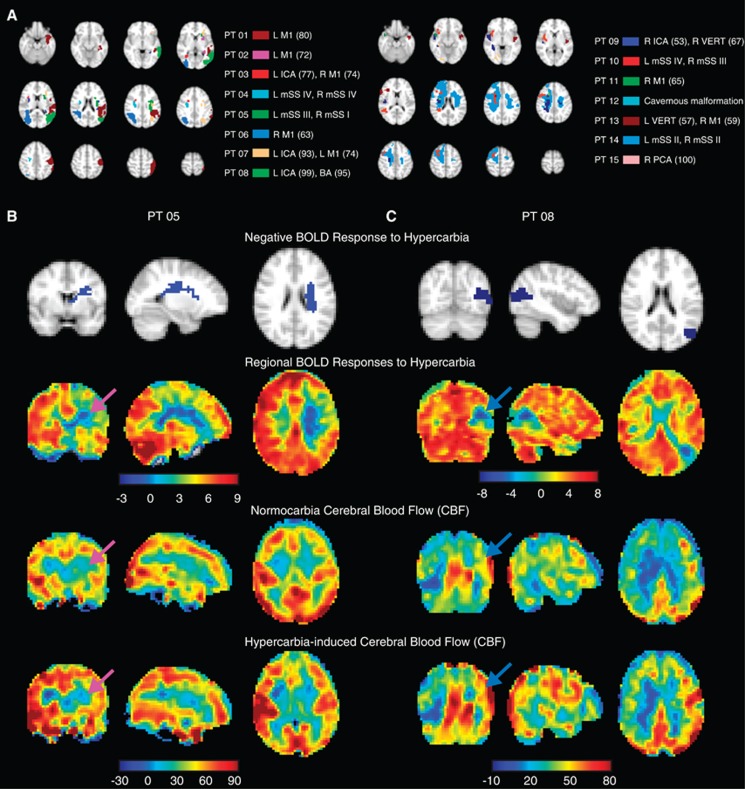
Figure 5.
(A) Locations of negative blood oxygenation level-dependent (BOLD) reactivity in the 15 patients exhibiting negative BOLD effects. The 4 mm axial maps have been subdivided into two images for clarity. Example cases of a participant with (B; patient 5) and without (C; patient 8) apparent vascular intracerebral steal. Orthogonal slices of the negative BOLD reactivity regions (blue) are shown on top, followed by BOLD reactivity maps and baseline and hypercarbia-induced cerebral blood flow (CBF) maps below. The arrows identify the regions of negative BOLD reactivity. In these regions, clear and significant (P<0.01) decreases in CBF are found in patient 5, yet increases in CBF are observed in patient 8. These findings suggest that the origins of negative BOLD reactivity cannot be solely attributable to vascular intracerebral steal effects. Findings are compared with angiography in Figure 6. ICA, internal carotid artery; mSS, modified Suzuki score; PCA, posterior cerebral artery.

