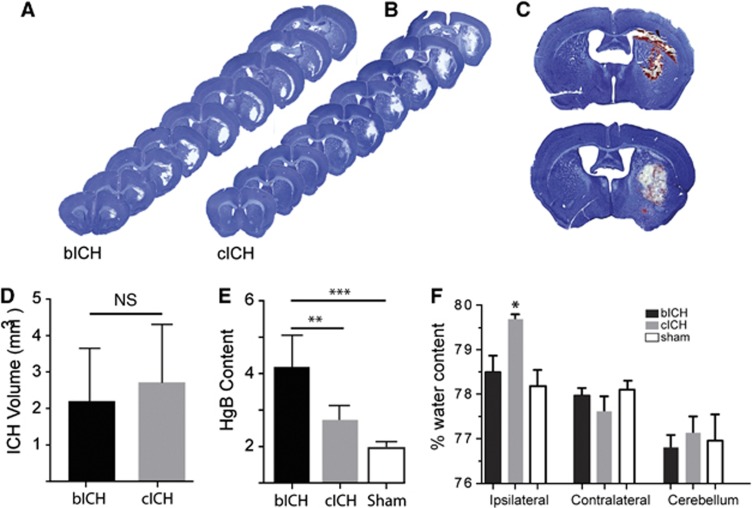
Figure 1.
Initial tissue damage after intracerebral hemorrhage (ICH). (A, B) Representative images of hemorrhage at 24 hours post ICH show a similar distribution and size of damage in the two hemorrhage models. There is no significance between autologous blood intracerebral hemorrhage (bICH) and collagenase intracerebral hemorrhage (cICH) at any coronal level, indicating similar lesion location. (C) Differences in blood density are visually apparent between the bICH and cICH 24 hours after ICH. (D) There is no difference between the sizes of the lesion at 24 hours in the two models. (n=13, bICH=2.201 mm3±1.362, cICH=2.716 mm3±1.560) (E) Hemoglobin content (Hgb) as expressed in ispilesional/contralesional spectroscopic readings. (bICH=3.843±1.058, cICH=2.069±0.492, sham=1.186±0.214, n=16, **P<0.01, ***P<0.001.) (F) Brain edema is expressed as the % water content in the cerebral hemisphere ipsilateral or contralateral to the hemorrhage or in the cerebellum. The brain edema is significantly greater in cICH than all other groups at 3 days post stroke (n=17, *P<0.05 ipsilateral versus contralateral cICH). NS, nonsignificant.

