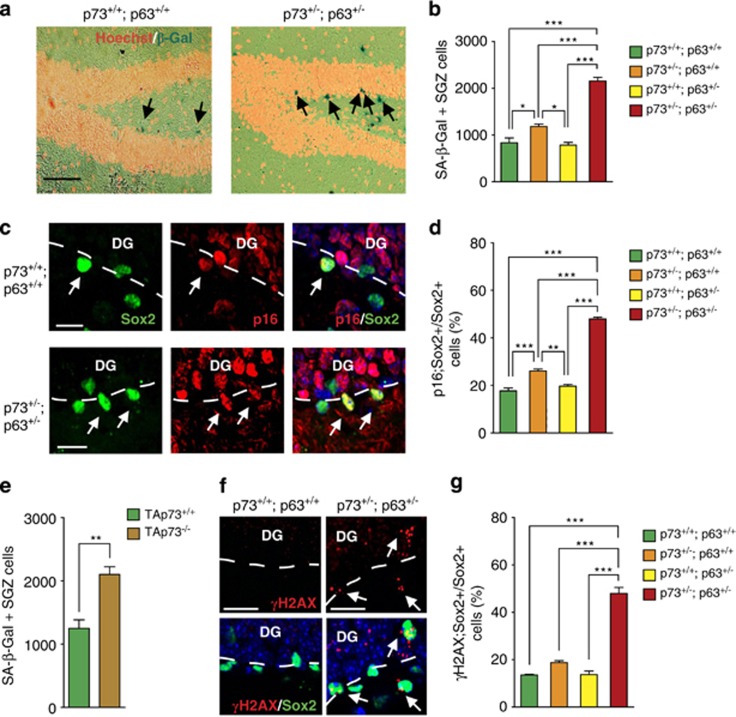
Figure 6.
Adult p63+/−; p73+/− dentate gyrus NPCs display increased senescence and DNA damage in vivo. (a and b) Coronal sections through the hippocampus of 3-month-old wild-type (p73+/+; p63+/+), p73+/−; p63+/+, p73+/+; p63+/−, and p63+/−; p73+/− mice were stained for senescence-associated β-galactosidase (SA-β-Gal; dark blue, arrows, a), counterstained with Hoechst (pseudocolored gold, a), and the total relative numbers of positive cells in the SGZ were quantified (b). *P<0.05, ***P<0.001, n=3 per genotype. Scale bar=100 μm. (c) Confocal micrographs through the wild-type and double heterozygote dentate gyrus immunostained for Sox2 (green), p16 (red), and counterstained with Hoechst 33258 (blue in the merged images on the right). Arrows denote double-positive cells, and the white hatched lines indicate the borders between the DG and the SGZ. Scale bar=18 μm. (d) Quantification of the proportion of Sox2-positive NPCs that were also positive for p16, as determined in 10 sections/mouse similar to those in c. **P<0.01, ***P<0.001, n=3 per genotype. (e) Quantification of the total relative numbers of SA-β-Gal-positive stained cells in the SGZ of 3-month-old wild-type (p73+/+; p63+/+) and TAp73−/− mice, analyzed as shown in a and b. **P<0.01, n=3 per genotype. (f) Confocal micrographs through the wild-type and double heterozygote dentate gyrus immunostained for Sox2 (green), γH2AX (red), and counterstained with Hoechst 33258 (blue in the merged images on the right). Arrows denote double-positive cells, and the white hatched lines indicate the borders between the DG and the SGZ. Scale bar=18 μm. (g) Quantification of the proportion of Sox2-positive NPCs that were also positive for γH2AX, as determined in 10 sections/mouse similar to those in f. ***P<0.001, n=3 per genotype

