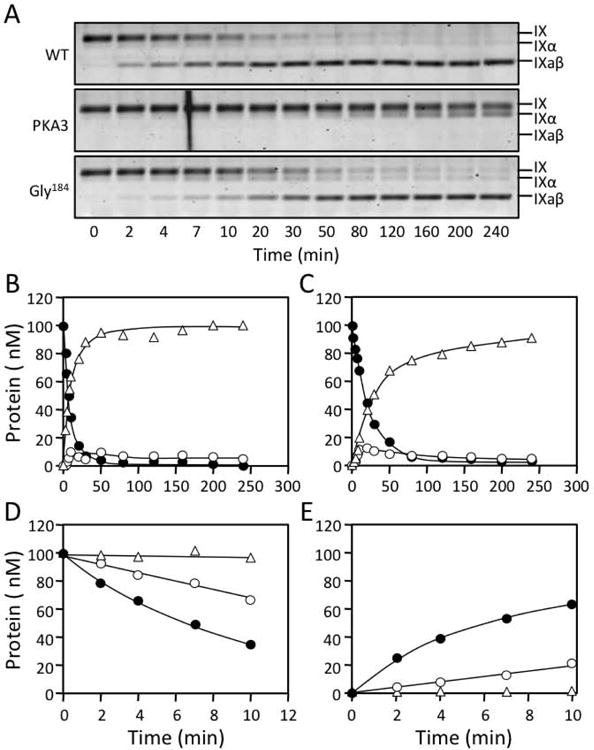
Figure 3. FIX cleavage by fXIa.

(A) Non-reducing 17% polyacrylamide-SDS gels of 100 nM fIX in Assay Buffer with Ca2+ incubated at RT with 3 nM active sites of fXIaWT (top), fXIa/PKA3 (middle) or, fXIa-Gly184 (bottom). Positions of standards for fIX, fIXα and fIXaβ are indicated at the right of each panel. (B & C) Progress curves of fIX disappearance (●), and fIXα (○) and fIXaβ (Δ) generation for (B) fXIaWT or (C) fXI-Gly184 from panel A. Lines represent least-squares fits to the data. (D) Initial rates of fIX disappearance for fXIaWT (●), fXIa-Gly184 (○) and fXIa/PKA3 (Δ) determined over the first 10 min of activation from panel A. (E) Initial rates of fIXaβ formation for fXIaWT (●), fXIa-Gly184 (○) and fXIa/PKA3 (Δ) determined over the first 10 min of activation from panel A.
