
Figure 5. Progress curves of fIX activation by fXIa183-185 and fXIa/PKA3 gain-of-function variants.
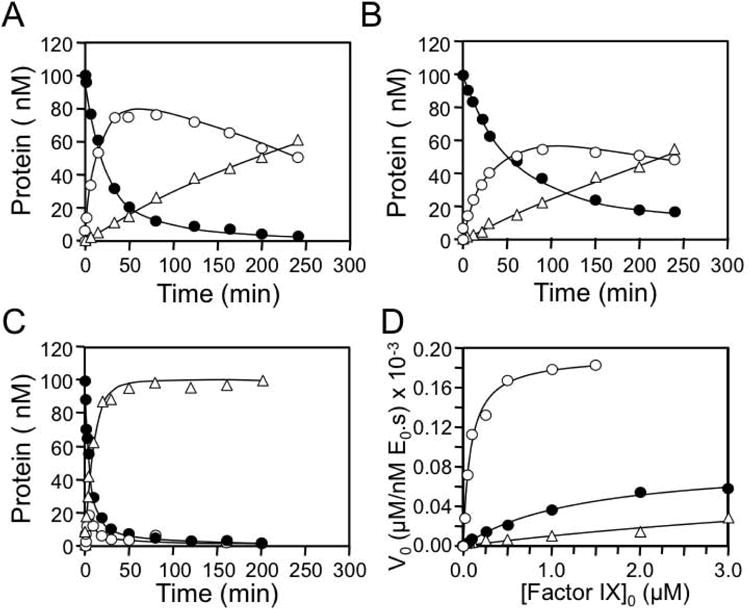
Shown are progress curves of fIX disappearance (●), and fIXα (○) and fIXaβ (Δ) generation for reactions containing 100 nM fIX and (A) 30 nM fXIa183-185, (B) 3 nM fXIa/PKA3-A, and (C) 3 nM fXIa/PKA3-B. Note the different fXIa concentrations used in the three reactions. FXIa concentrations represent the concentration of active subunits. (D) Initial velocities of cleavage of fIX after Arg145 (conversion of fIX to fIXα) by fXIa183-185 (Δ), fXIa/PKA3-A (●), and fXIa/PKA3-B (○) as a function of fIX concentration.