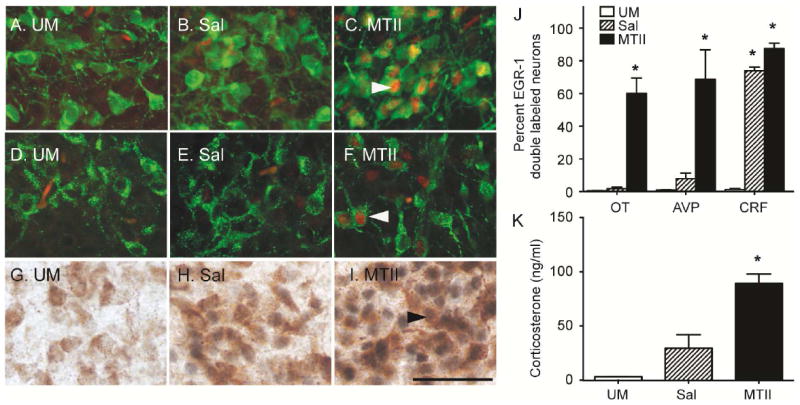
Figure 5. MTII-induced neuropeptide activation in the PVN.

PND6-7 neonates were euthanized 1hr after an acute peripheral injection of 10mg/kg MTII and representative images of brains processed for immunohistochemistry for OT-EGR1 (A,B,C), AVP-EGR1 (D,E,F), and CRF-EGR1 (G,H,I) are shown. The left panel was handled (A,D,G), the middle was injected with saline (B,E,H), and the right received MTII (E,F,I). In fluorescent images, OT and AVP positive cell bodies are green and EGR1-labeled nuclei are red. In DAB processed slices, CRF cell bodies are brown, and EGR1 nuclei are black. MTII elicited significant activation in OT, AVP, and CRF neurons, whereas saline only activated CRF cells in comparison to handled controls (J). MTII injected neonates mounted a corticosterone response (K). H, handled. Color channels were adjusted in Image J (NIH) for fluorescent images. Asterisks indicate Student’s t-tests with p< 0.05. Scale bar represents 50 μM.
