Figure 1.

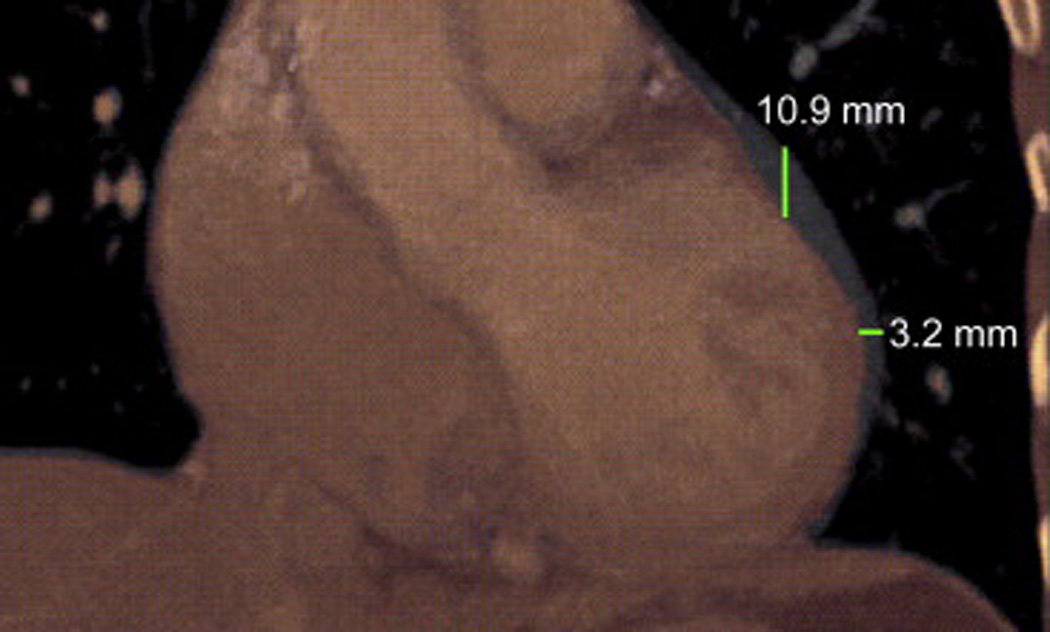
Superimposed minimum intensity projection (mIP, in thermal color) images and maximum intensity projection (MIP, in gray) images show the extent of cardiac motion in the SI and LR directions on a coronal-view slice of the CT images.

Superimposed minimum intensity projection (mIP, in thermal color) images and maximum intensity projection (MIP, in gray) images show the extent of cardiac motion in the SI and LR directions on a coronal-view slice of the CT images.