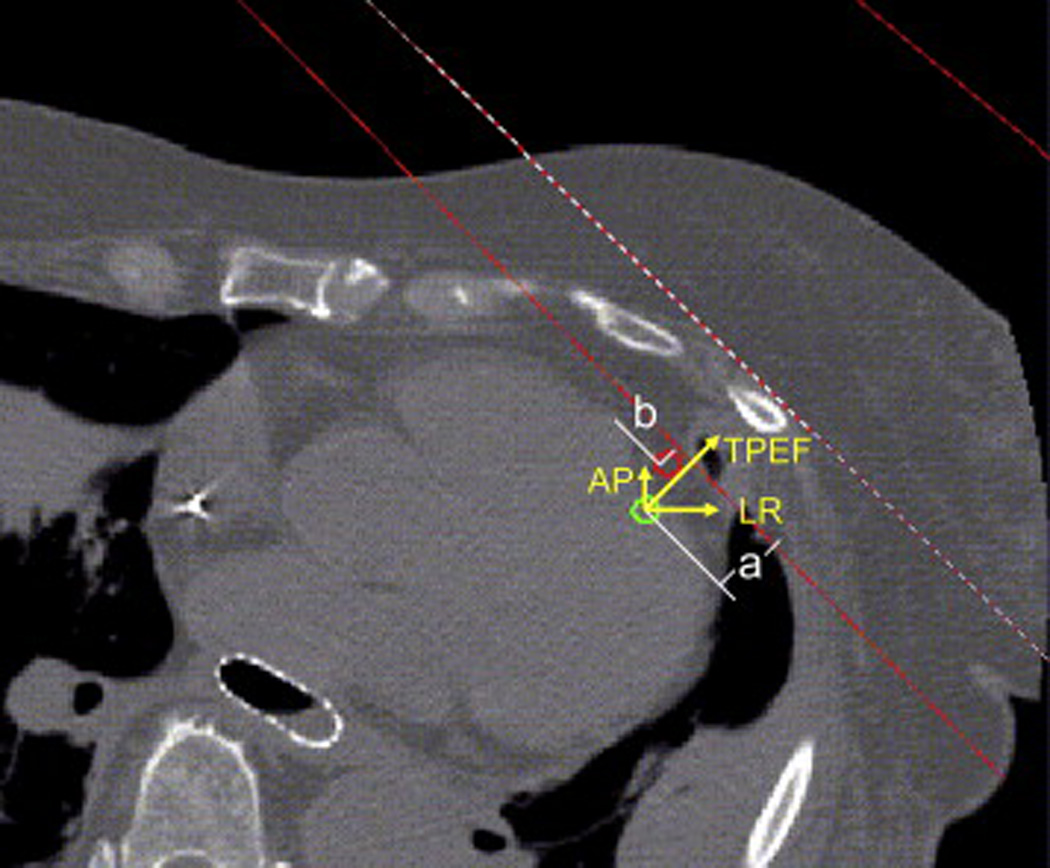
Figure 2.

An axial slice of an averaged CT dataset from one patient illustrates the location of the tangential beams (red solid lines), fused LAD contours in the systolic phase (green contour) and the diastolic phase (red contour), and the three directional axes indicating anteroposterior (AP), left-right (LR), and toward the posterior edge of the treatment field (TPEF).
