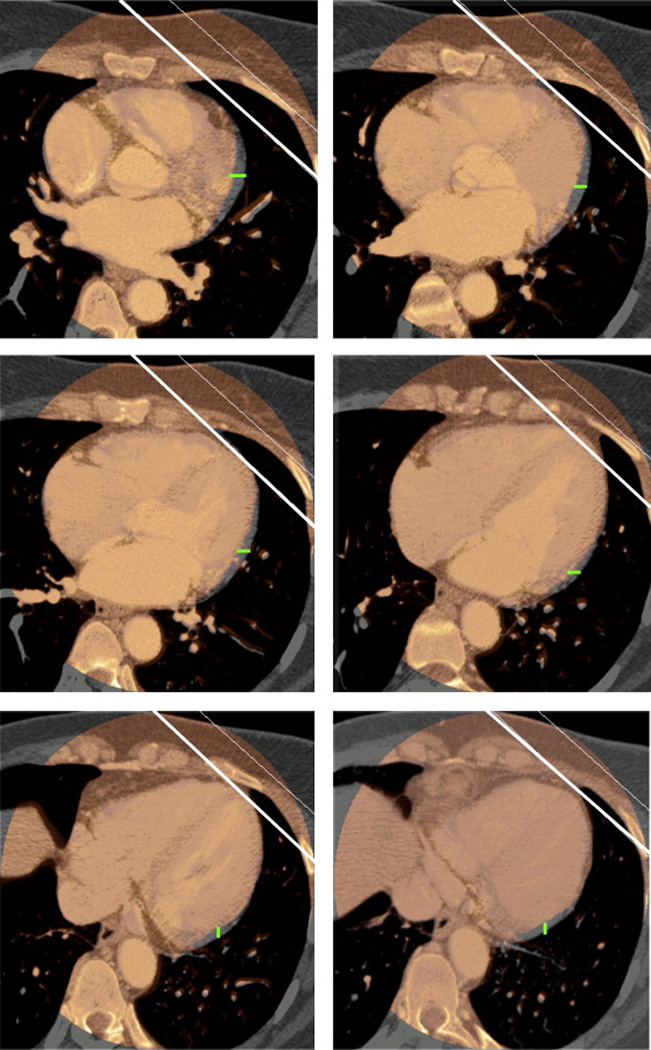
Figure 3.

Displacement of the heart periphery relative to the RT treatment fields on six sequential axial CT slices, with superimposition of systolic (in thermal color) and diastolic (in gray) CT images. White lines illustrate the location of the tangential beams. Green lines illustrate the extent of displacement of the heart periphery between systole and diastole.
