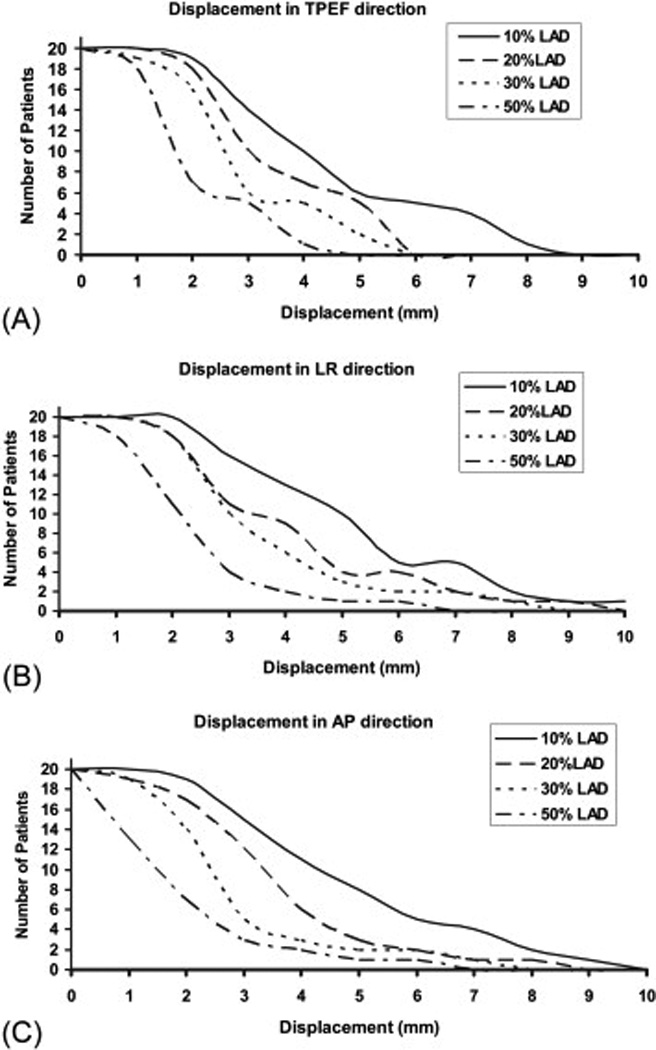
Figure 6.

Numbers of patients (the y axis) who had at least 10%, 20%, 30% and 50% of the LAD volume displaced by a certain set value (e.g., 1 mm, 2 mm, 3 mm, etc; the × axis) in the (A) toward the posterior edge of the treatment field (TPEF), (B) left-right (LR), and (C) anteroposterior (AP) directions.
