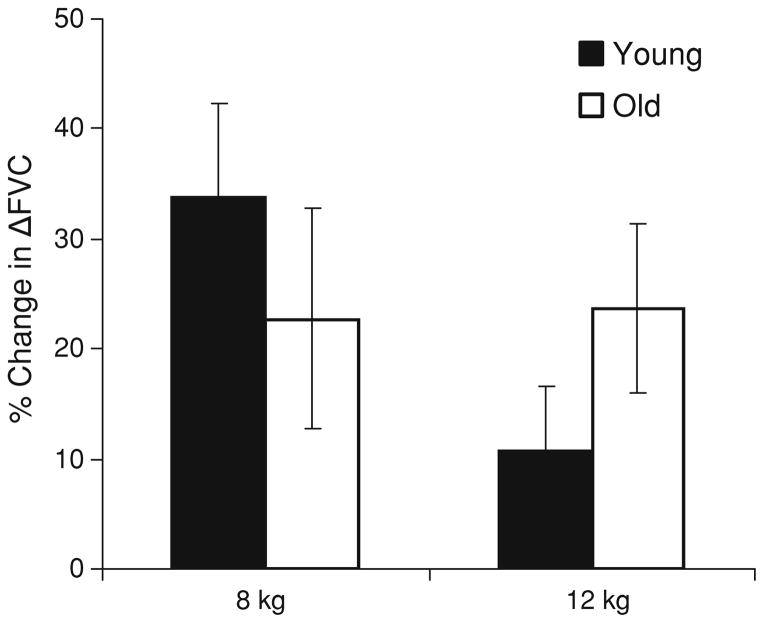
Fig. 2.
Compensatory responses to hypoxia during exercise. Data are presented as mean ± SE. Values represent a change in vascular conductance due to hypoxia (compensatory vasodilation) and are expressed as a relative change in ΔFVC with hypoxia . Vascular responses were not different between groups (No effect of group)

