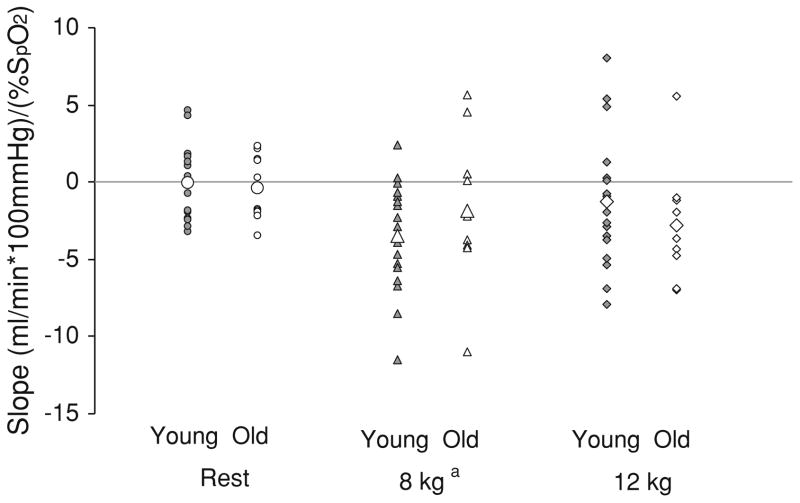
Fig. 3.
Individual stimulus–response relationships to hypoxia during rest and exercise. Data are presented as individual data points; large open symbols signify group means. Values were calculated as the two-point slope of the relationship between ΔFVC and arterial oxygen saturation (SpO2) to assess individual vascular responses to hypoxia. Negative values represent net hypoxia-mediated vasodilation; positive values represent vasoconstriction. Vascular responses to exercise increased at 8 kg exercise intensity (main effect of exercise: ap < 0.05 vs. rest) and were not different between groups (no effect of group)

