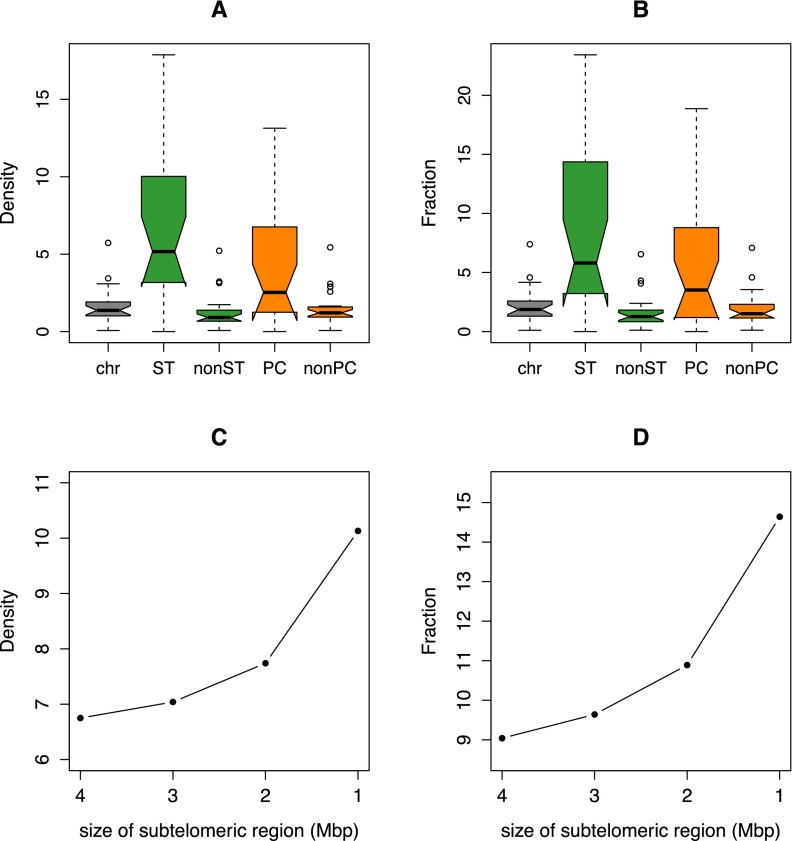
Figure 2.
Distribution of the density (A) and fraction (B) of H3K4me3-enriched human-specific regions in all chromosome (chr), subtelomeric (ST), nonsubtelomeric (nonST), pericentromeric (PC), and nonpericentromeric (nonPC) regions. Note the significant concentration of these epigenetic decorations in the highly plastic subtelomeric and pericentromeric sections of the human genome (density, one-way χ2 test, P-values = 4 × 10−73 and 3 × 10⁻¹⁵, respectively; fraction, Fisher’s exact test, P-values = 2 × 10−56 and 2 × 10⁻¹³, respectively). See Table 1 for nomenclature. Comparison of density (C) and fraction (D) of human-specific H3K4me3 modifications in subtelomeric regions of different size (4, 3, 2, and 1 Mbp).

