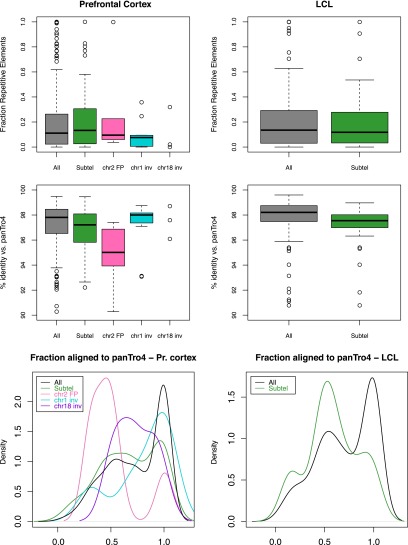
Figure 5.
Human-enriched H3K4me3 peaks in prefrontal cortex (left panels) and LCLs (right panels). Fraction of repetitive elements (top panels), percentage of identity (center panels), and fraction aligned to the chimpanzee genome (panTro4) (bottom panels) of all human enriched peaks and peaks mapping to subtelomeric regions, HSA2 fusion points, HSA1 inversion breakpoints, and HSA18 inversion breakpoints (the rearranged points for prefrontal cortex only).

