Figure 4.
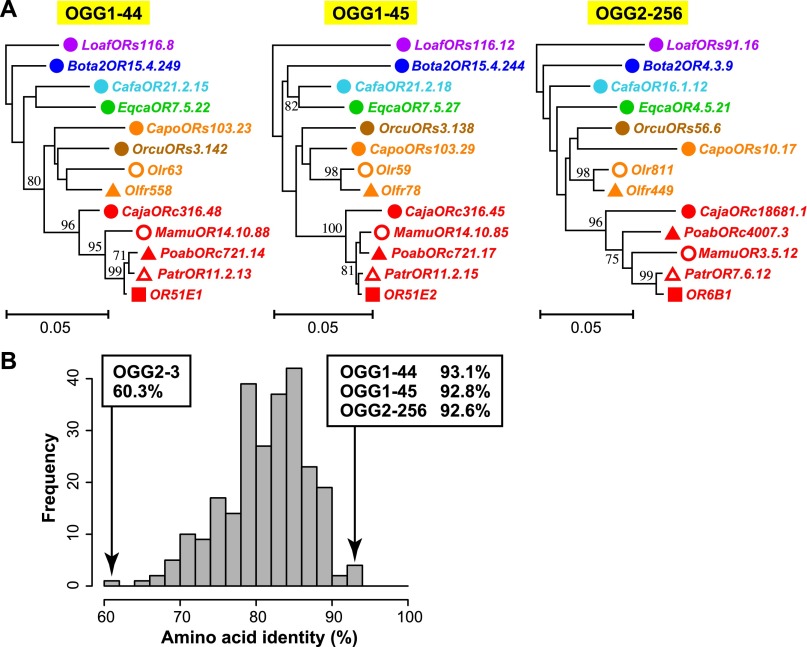
Conserved OGGs showing complete one-to-one orthology. (A) NJ phylogenetic trees for OGG1-44, OGG1-45, and OGG2-256. A colored symbol of a gene name indicates a species depicted in Figure 3B,D. Each scale bar indicates the number of amino acid substitutions per site. Bootstrap values obtained from 500 resamplings are shown only for the nodes with bootstrap values >70%. (B) Distribution of amino acid sequence identities between intact human and mouse OR genes for 252 OGGs containing at least one intact gene from both human and mouse. Note that pseudogenes and truncated genes were not used for the calculation of amino acid sequence identity. When an OGG included two or more genes from either or both species, the mean of the amino acid sequence identities for all possible interspecies combinations of genes was used. The OGGs with the three highest amino acid sequence identity values and that with the lowest value are shown with the respective percent identity. The mean and the median amino acid sequence identity among the 252 OGGs are 81.3% and 82.1%, respectively.

