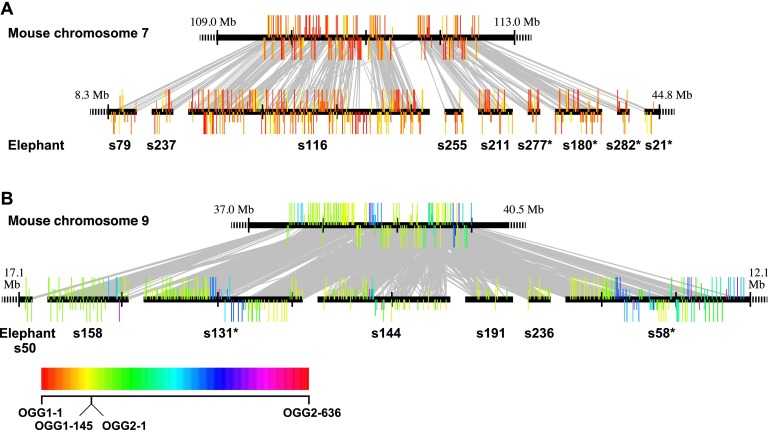
Figure 5.
Comparison of OR gene clusters between mouse and African elephant. (A) A mouse cluster on chromosome 7 (Mm7.6) corresponded to nine elephant clusters, and (B) a mouse cluster on chromosome 9 (Mm9.3) corresponded to seven elephant clusters (see Supplemental Table S5). Each horizontal line represents a mouse chromosome (top) or a scaffold of the African elephant genome (bottom). The position of each OR gene is represented by a colored vertical bar above or below a horizontal line, the latter indicating the opposite transcriptional direction to the former. Long, medium, and short vertical bars depict an intact gene, a truncated gene, or a pseudogene, respectively. Each bar is colored according to the OGG to which the OR gene belongs; the color code chart is at the bottom of the figure. Class I OGGs are colored between red and yellow in the color chart in order of OGG numbers, while Class II OGGs are colored between yellow and red. When a mouse gene and an elephant gene belong to the same OGG, the two genes are connected by a gray line. The scaffold number for each elephant cluster is shown below the diagram; for example, “s79” indicates scaffold79. A scaffold with an asterisk (e.g., s277*) indicates that the respective scaffold is drawn in reverse orientation. A black vertical bar on a horizontal line is shown at intervals of 1 Mb. (A,B) The rightmost and the leftmost elephant scaffolds (s79 and s21 in A and s50 and s58 in B) contain one-end truncated clusters, while the others contain both-end truncated clusters. A dashed horizontal line indicates that DNA sequences are omitted. The entire length is drawn for a scaffold containing a both-end truncated cluster.

