
Figure 1.
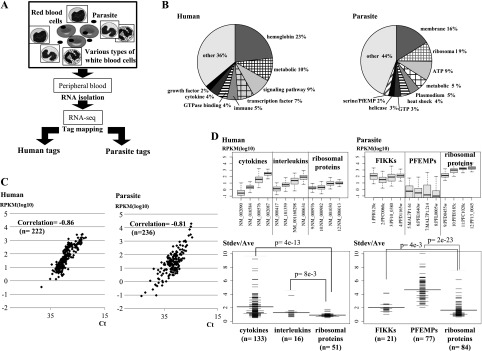
RNA-seq analysis of human-parasite mixed transcriptomes. (A) Schematic representation of the RNA-seq analysis using mixed human-parasite RNA. Note that in each sample, different cell types from both humans and parasites are represented. (B) Distribution of the RNA-seq tags assigned to the indicated functional categories of genes in humans (left) and parasites (right). Definitions of the gene categories are shown in Supplemental Table 3. (C) Real time RT-PCR validation of the RNA-seq analysis. A total of 458 cases ([left panel] 222 cases in humans; [right panel] 236 cases for parasites) were examined. Overall correlation between RNA-seq and real time RT-PCR-based gene expression was r = −0.83 (r = −0.86 in humans; r = −0.81 in parasites). (D) (Top) Distributions of the relative deviations in gene expression patterns in humans (left) and parasites (right). Relative deviation was calculated as the standard deviation divided by the average of the expression levels for each gene. (Bottom) Distribution of the variance in gene expressions for the indicated categories of genes. The y-axis represents the standard deviation of the gene expression level (Stdev) divided by the average gene expression level (Ave) for the corresponding gene in the 116 patients. Horizontal bar represents the average of the Stdev/Ave value for the category. The number of genes (n) included in the analysis for each category is shown in parentheses. All of the data for the genes binned under each category are presented in Supplemental Table 4.