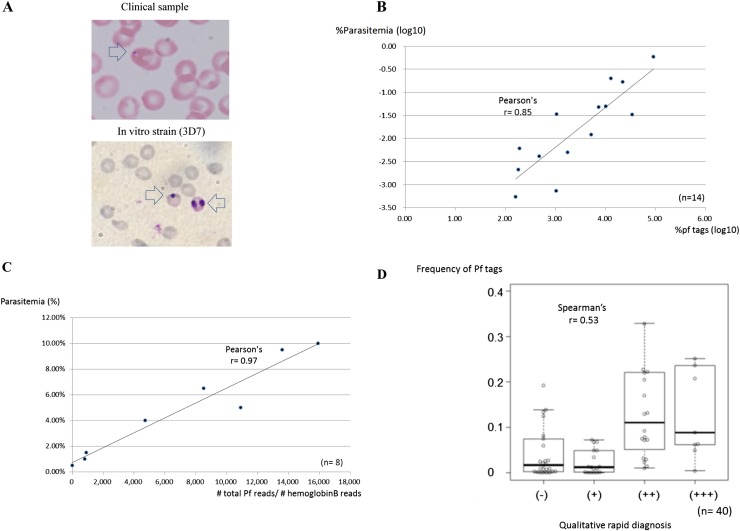
Figure 2.
Associations of RNA-seq read counts and clinical information of parasitemia. (A) Representative image of a thin blood film from a clinical sample (top) and 3D7 (bottom) from which infected red blood cells were counted and parasitemia was calculated. Arrow indicates the stained parasite. (B) Relation between the Pf read counts and the parasitemia, which was diagnosed by a microscopic view of the thin blood film (n = 14). Numbers of infected red blood cells were counted microscopically. (C) Results of a similar analysis from an in vitro cultured Pf strain, 3D7. Parasites were cultured at the indicated parasitemia, which was validated microscopically and used for the RNA-seq analysis, as in the case in the clinical samples (n = 8). Pf tag counts were normalized with those of the human beta globin gene. (D) Qualitative comparison between clinical parasitemia and Pf read counts (n = 40). For this analysis, parasitemia was qualitatively determined by rapid diagnosis according to the standard protocol. The correlation coefficient calculated by the indicated methods is shown in the respective graphs.

