
Figure 3.
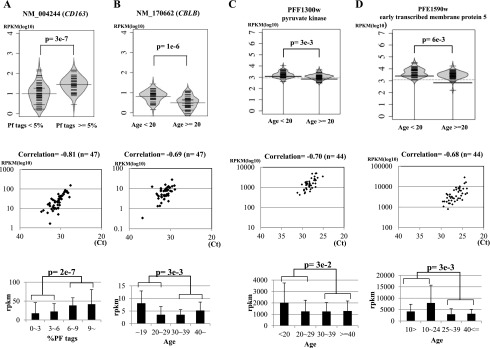
Association of gene expression patterns with clinical information. Examples of human genes (A,B) and parasite genes (C,D) associated with the indicated clinical information. (Top) Bean plots of the gene expression levels (y-axis in reads per kilobase per million, RKPM) are shown for the indicated populations. Statistical significances (P) of the differences are shown within the plots. (Middle) Validation analysis of the expression levels by real-time RT-PCR. (Bottom) Differential expressions, identified by both RNA-seq tag counts and real-time RT-PCR validations, are shown for further breakdown of the populations. Particularly for human genes (A,B), gene expression levels for the healthy controls are shown in Supplemental Figure 5. Detailed evaluation of the statistical significances in the differences against the control samples is also shown there. Data represent the means of three experiments. The number of samples used (n) is as indicated in the margin. Note that demographic data were not always available for all of the samples. Statistical significances of the indicated differences are shown above the plots.