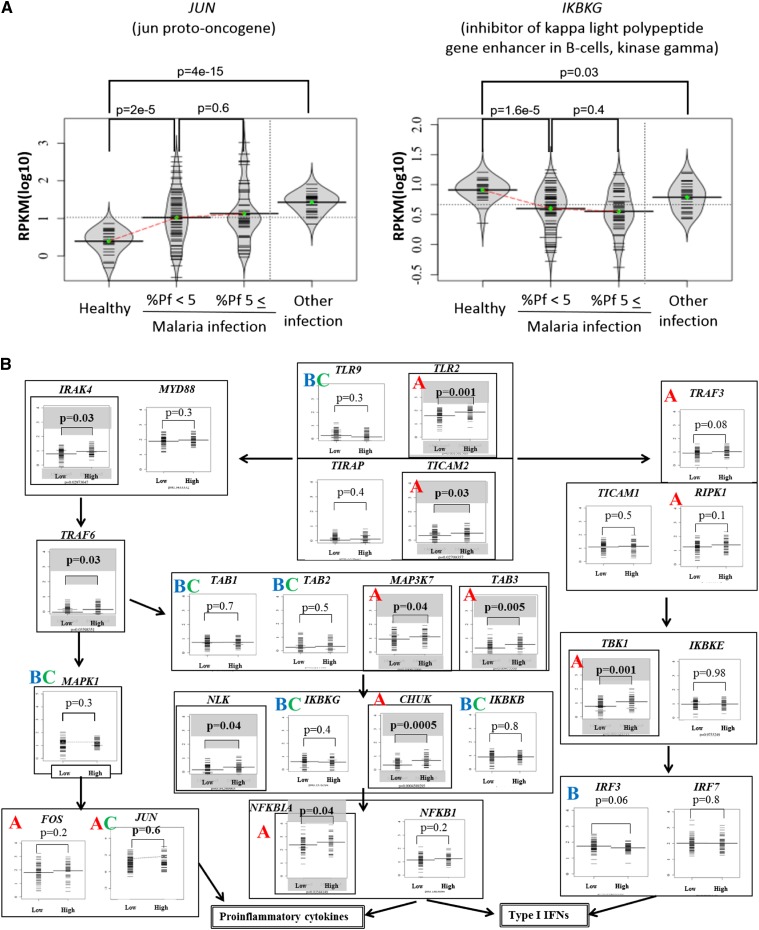
Figure 4.
Gene expression patterns of the TLR4 pathway genes. (A) Examples of the gene expression patterns between healthy controls, malaria patients with %Pf tags of <5%, >5%, and patients with other infectious diseases. Left and right panels exemplify the cases where gene expression levels increased with increasing %Pf tags (the case of the JUN gene) and where they decreased (the case of the IKBKG), respectively. Also note that left and right panels exemplify the cases where the observed difference was malaria-specific and nonmalaria-specific, respectively, which was revealed by considering the control patients with other infectious diseases. Statistical significances in the differences were evaluated by Wilcoxon signed rank test and are shown in the margins. (B) Global patterns of gene expression in the TLR4 pathway. Significant differences between two populations (%Pf tags of >5% or <5%) are shown above the plots. Genes significantly up-regulated in the patients with high %Pf tags (P < 0.05) are enclosed in bold boxes. Also, by considering the controls (healthy controls and patients with other infectious diseases), “A” and “B” indicate genes where the increase and decrease in the gene expressions were observed for the increasing or decreasing %Pf tags, respectively, and such differences were statistically significant against healthy controls. Among them, “C” indicates the cases where the gene expression differences were significant against the control patients with other infectious diseases, thus, the difference appeared to be malaria-specific. For evaluating statistical significance in the differences, Wilcoxon signed rank test was used.

