
Figure 5.
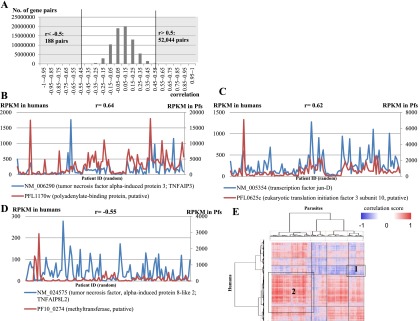
Positive and negative correlations between expression patterns of human and parasite genes in 116 patients. (A) Distribution of the Spearman’s correlation coefficients calculated for each pair of human-parasite genes. The number of gene pairs with correlation coefficients >0.5 (positive correlation) or < −0.5 (negative correlation) is given to the right and left, respectively. (B–D) Examples of positively (B,C) and negatively (D) correlated human (blue) and parasite (red) gene pairs. (B) The human tumor necrosis factor alpha-induced protein 3 (TNFAIP3) and the parasite putative polyadenylate-binding protein gene; (C) the human JUND and the parasite putative eukaryotic translation initiation factor 3 subunit 10 gene; (D) the human TNFAIP3 and the parasitic putative methyltransferase gene. Spearman’s correlation coefficients are shown above each plot. On the x-axis, patients are ordered by their patient ID numbers (random order). (E) Hierarchal clustering analysis. Vertical and horizontal axes represent the human and parasite genes, respectively, each of which was paired with at least one gene in the other organism with a Spearman’s coefficient of either >0.5 or < −0.5. The heat map represents the degree of correlation according to the color scale shown in the legend. Numbered boxes represent clusters where genes with the indicated functional categories described in the text are enriched.