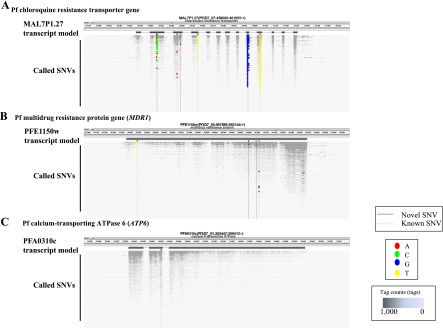
Figure 6.

Identification of SNVs in parasite putative drug resistance-related genes. (A–C) SNVs detected in the Pf chloroquine resistance transporter gene (A), Pf multiple drug resistance gene 1 (PfMDR1) (B), and the Pf calcium-transporting ATPase 6 gene (PfATP6) (C). Patients are ordered by their sample ID numbers (randomly) on the y-axis. Base changes observed at the indicated positions for each patient are indicated according to the color scheme shown in the legend. Only the nonsynonymous SNPs are shown. The number of tags mapped at each genomic coordinate is represented by the grayscale shown in the legend. Positions of the SNPs that were previously reported (known) or newly identified in this study (novel) are indicated by gray and black vertical lines, respectively. For detailed information on SNPs in each sample, see Supplemental Table 10. Also note that SNPs located in overlapping regions of the splicing sites may have an increased error rate, which is derived from mapping of RNA-seq tags onto the genome sequence. Further intensive manual inspection may be necessary for these sites (Supplemental Table 1).
