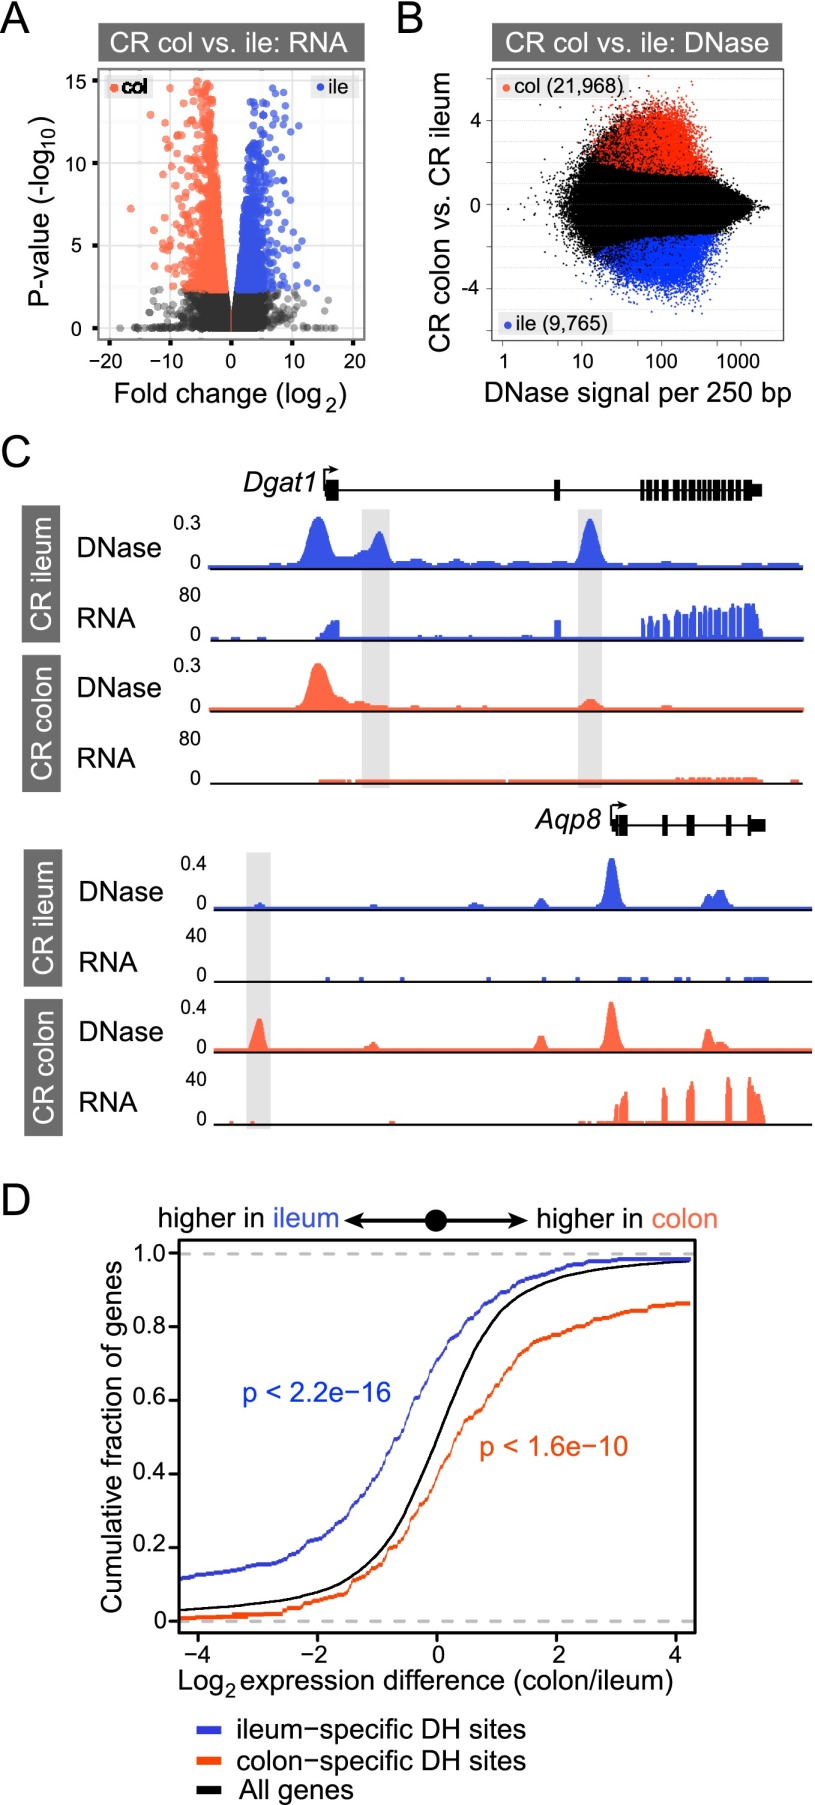
Figure 3.
Differential open chromatin between ileal and colonic IECs correlates with differential gene expression. (A) Volcano plot showing pairwise comparison of RNA expression between conventionally raised (CR) ileal and colonic epithelium. Blue and orange dots represent genes more highly expressed in the ileum or colon, respectively (FDR < 0.05). (B) The fold difference in DNase signal intensity from CR ileal versus colonic IECs plotted against the average DNase signal observed in 250-bp windows. Significantly differential windows are highlighted in red and blue (FDR < 0.0001). (C) Representative signal track view highlighting two genes, diacylglycerol O-acyltransferase 1 (Dgat1) and aquaporin 8 (Aqp8), that exhibit differential open chromatin and transcript abundance in the ileum or colon. (D) Two-sided Kolmogorov-Smirnov goodness-of-fit test shows a positive relationship between the presence of a nearby tissue-specific DHS (within 2 kb of and including the gene body) and increased transcript abundance in that tissue. The y-axis shows the cumulative fraction of genes linked to a nearby tissue-specific DHS. Deviation from the null expectation that linked genes display a normal distribution centered on a fold change of 1 (black line) suggests that segment-specific DHSs are enriched near genes of higher expression in that tissue. See also Supplemental Figures S5 and S6.

