
Figure 4.
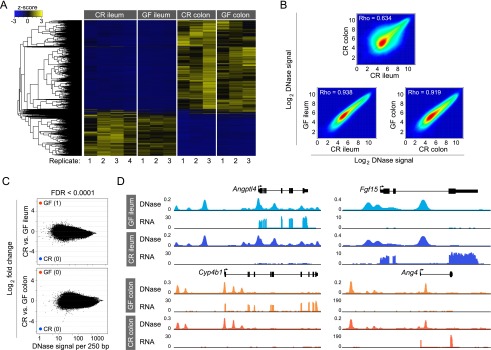
Life in the presence or absence of microbiota does not affect the intestinal epithelial accessible chromatin landscape. (A) Hierarchical clustering of differential DHSs across all replicates of conventionally raised (CR) versus germ-free (GF) ileal and colonic IECs. Note the similarity between GF and CR conditions for each tissue. (B) Density scatter plot showing the correlation of DNase-seq signal intensity for the top 100,000 DHSs for CR colon and CR ileum (top), GF ileum and CR ileum (bottom left), and GF colon and CR colon (bottom right). (C) The fold difference in DNase signal intensity plotted against the average DNase signal observed in 250-bp windows. Significantly differential windows are highlighted in red and blue (FDR < 0.0001). Comparing across tissues (CR colon vs. CR ileum) discovered thousands of differential DNase hypersensitive sites (see Fig. 3B). Comparing tissues in the presence or absence of microbiota reveals undetectable change in the open chromatin landscape in response to microbiota. (D) Representative signal track highlighting multiple genes in the ileum or colon that show differences in transcript abundance in the presence of microbiota but no change in the open chromatin landscape. (Angptl4) Angiopoietin-like 4; (Fgf15) fibroblast growth factor 15; (Cyp4b1) cytochrome P450, family 4, subfamily b, polypeptide 1; (Ang4) angiogenin, ribonuclease A family, member 4. See also Supplemental Tables S3 and S7.