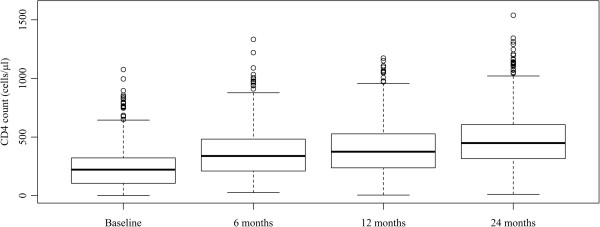
Figure 1.

Box plot of CD4 count distribution at baseline and 6, 12, and 24 months after antiretroviral therapy initiation. Pair-wise comparisons of baseline measurement with 6-, 12-, and 24-month time points indicate statistically significant differences (Wilcoxon paired test).
