
Fig. 8:
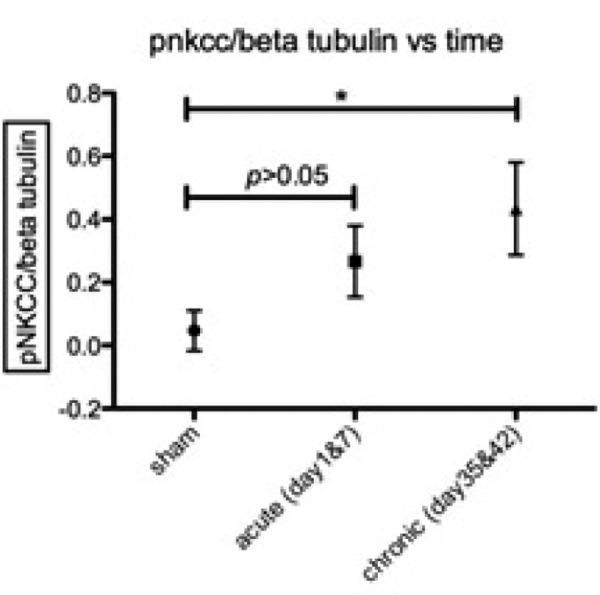
Time course of NKCC1 co-transporter phosphorylation following cSCI. p-NKCC was analyzed on western blots using the anti-p-NKCC antibody R5 and normalized to beta-tubulin. This value reflects the normalized amount of NKCC1 that is phosphorylated. Data are means ± s. e. m., n = 3 at sham, acute and chronic phases. One-way ANOVA determined a significant increase in the chronic phase (p<0.05). Asterisks indicate a significant difference (p<0.05) from sham.