Fig. 6:

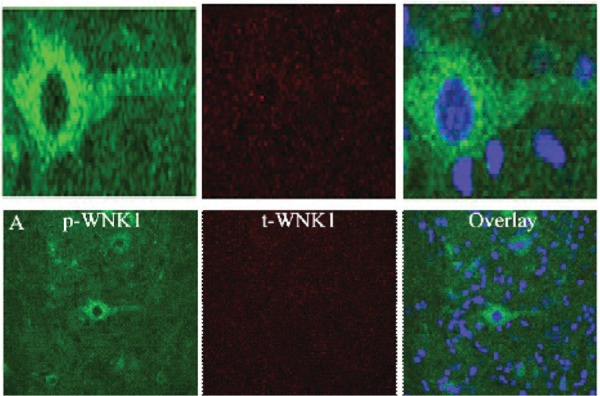
WNK1 expression at epicenter and rostral site following SCI at Day 1. Epicenter. pWNK1 staining (R&D Systems, 1:100, Left), tWNK1 staining (R&D Systems, 1:100, Middle), and overlay with pWNK1, tWNK1, and ToPro3 nuclei staining (Right).

WNK1 expression at epicenter and rostral site following SCI at Day 1. Epicenter. pWNK1 staining (R&D Systems, 1:100, Left), tWNK1 staining (R&D Systems, 1:100, Middle), and overlay with pWNK1, tWNK1, and ToPro3 nuclei staining (Right).