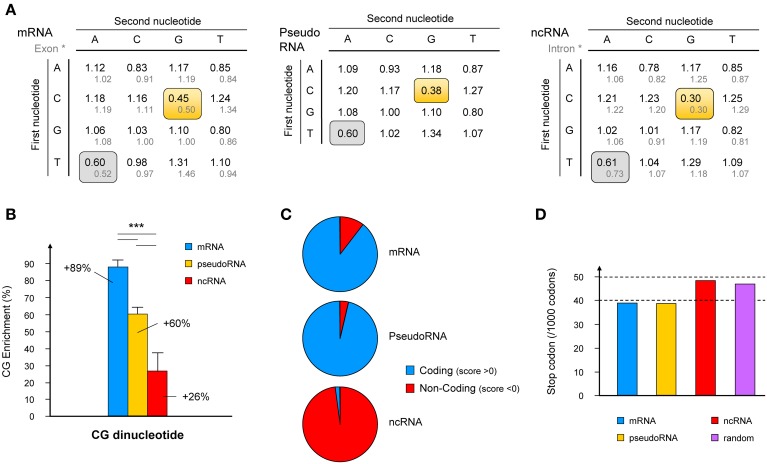
Figure 1.
Characterization of specific features of the “bona fide” lncRNA database. (A) Frequencies of occurrence of dinucleotides amongst the “bona fide” lncRNAs compared to that in mRNAs and pseudogenic RNAs (pseudoRNA) and compared to published dinucleotide frequencies in intronic and exonic sequences (Bulmer, 1987) (gray text). Frequencies of underrepresented dinucleotides are framed in gray where no difference is observed, or yellow where differences between mRNA, pseudoRNA and lncRNA are observed. (B) The CG dinucleotide signature for mRNAs, pseudoRNAs and lncRNAs is expressed as a% enrichment over the frequency of CG dinucleotide in the whole human genome. Histograms represent mean values ± s.e.m. ***p-value < 0.005 (student's t-test, two-sided). (C) Raw data obtained from CPC (Coding Potential Calculator; http://cpc.cbi.pku.edu.cn) using the three databases (mRNA, pseudoRNA and lncRNA) were plotted according to the number of sequences presenting negative (non-coding prediction) or positive (coding capacity) scores. (D) Using data extracted from EMBOSS CUSP tool (http://emboss.sourceforge.net), which creates a codon usage table from a nucleotide sequence, the number of stop codons per 1000 bases is represented for the three databases and a set of random sequences generated using the Random DNA Sequence Generator software (http://users-birc.au.dk/biopv/php/fabox).

