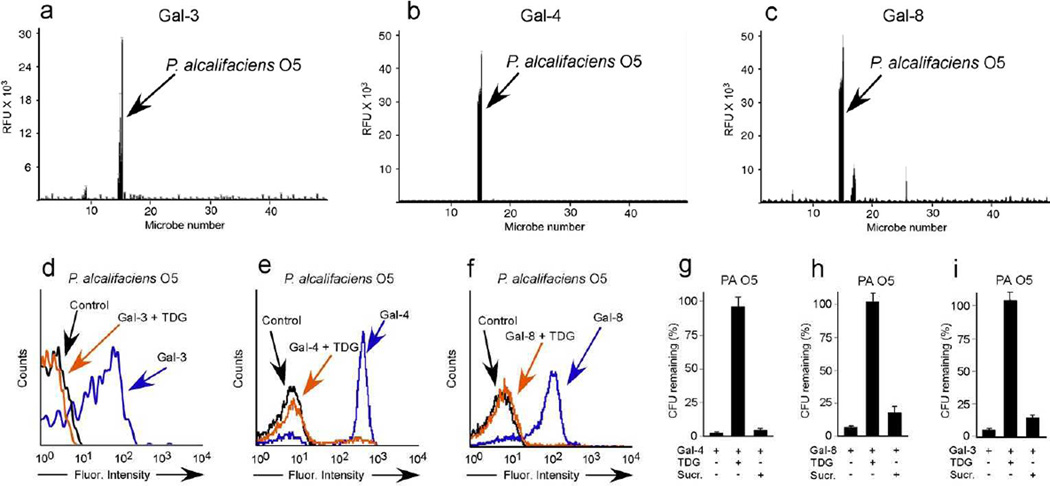
Figure 2. MGM identifies new bacterial targets for galectin binding and killing.
MGM data obtained after incubation with fluorescently tagged Gal-3 (a), Gal-4 (b), and Gal-8 (c) at ~1.5µM. See Supplemetnary Dataset 1 for complete microarray data. Flow cytometric analysis of P. alcalifaciens O5 (PA O5) after incubation with Gal-3 (d), Gal-4 (e), or Gal-8 (f) at ~0.1µM with or without inclusion of 20mM TDG. Quantification of PA O5 after addition of 5µM Gal-4 (g), Gal-8 (h) or Gal-3 (i) with or without addition of 50mM TDG or sucrose (Sucr). n=2–3 in 1 representative experiment of 3; error bars represent means ± 1 s.d.

