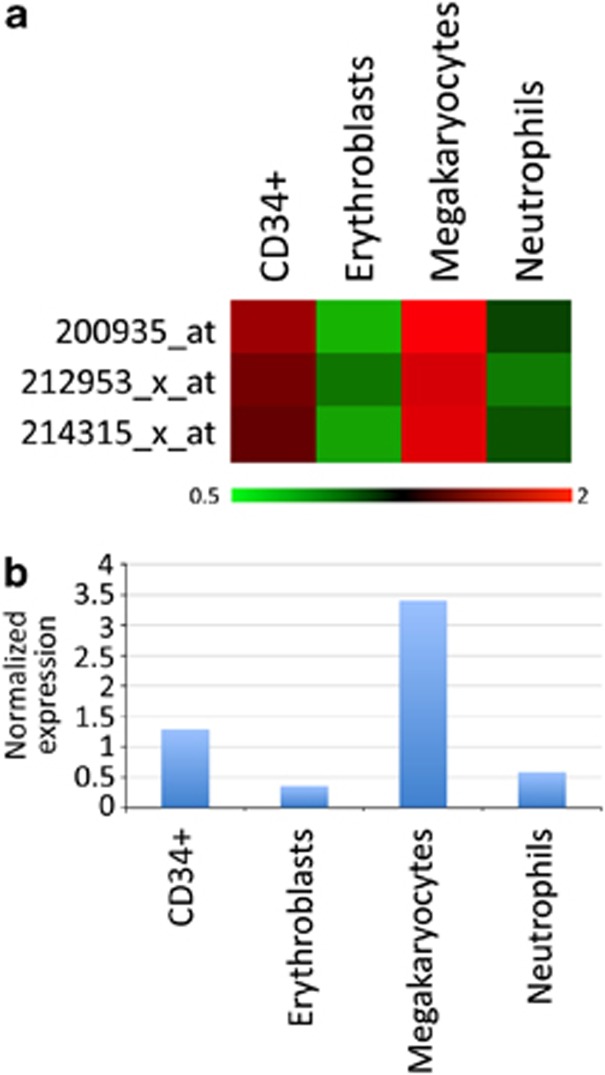
Figure 5.
CALR expression in hematopoietic progenitors and differentiated cells. CALR expression profile were analyzed in purified CD34+ cells, erythroblasts, megakaryocytes and neutrophils. (a) Heatmap showing the mRNA expression detected by the three different CALR probesets present on the HG-U133A array. Gene expression coloring was based on normalized signals, as shown at the bottom. The expression values were normalized on the median of all samples. (b) Bar graph displaying the average normalized expression detected by the three CALR probesets in the populations examined.

