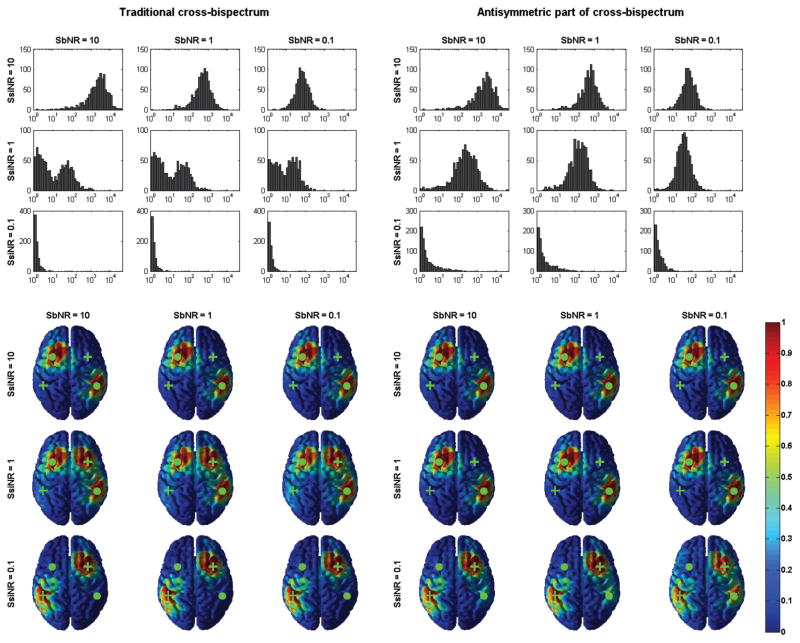
Figure 3.
Top panels: histograms of 1/(1 − r), with r being the second of the two canonical correlation coefficients between true and estimated topographies of interacting sources, for all combinations of SbNR and SsiNR. Bottom panels: an example of recovered brain sources (after MOCA and inverse method therein). The green dots mark the location of truly interacting sources; the green crosses mark the location of self-interacting sources.

