
Fig. 2.
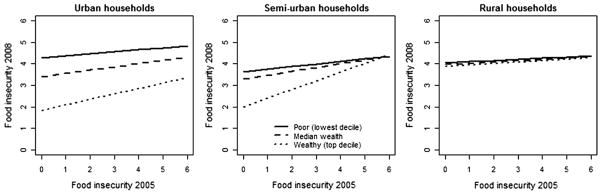
Model predicted estimates of 2008 food insecurity by place, wealth level, and 2005 food insecurity status. Fitted values are calculated at the 10th, 50th, and 90th percentiles of wealth within each area, holding the values of all other variables constant at their area means. The sample includes 936 urban households, 691 semi-urban households, and 978 rural households.