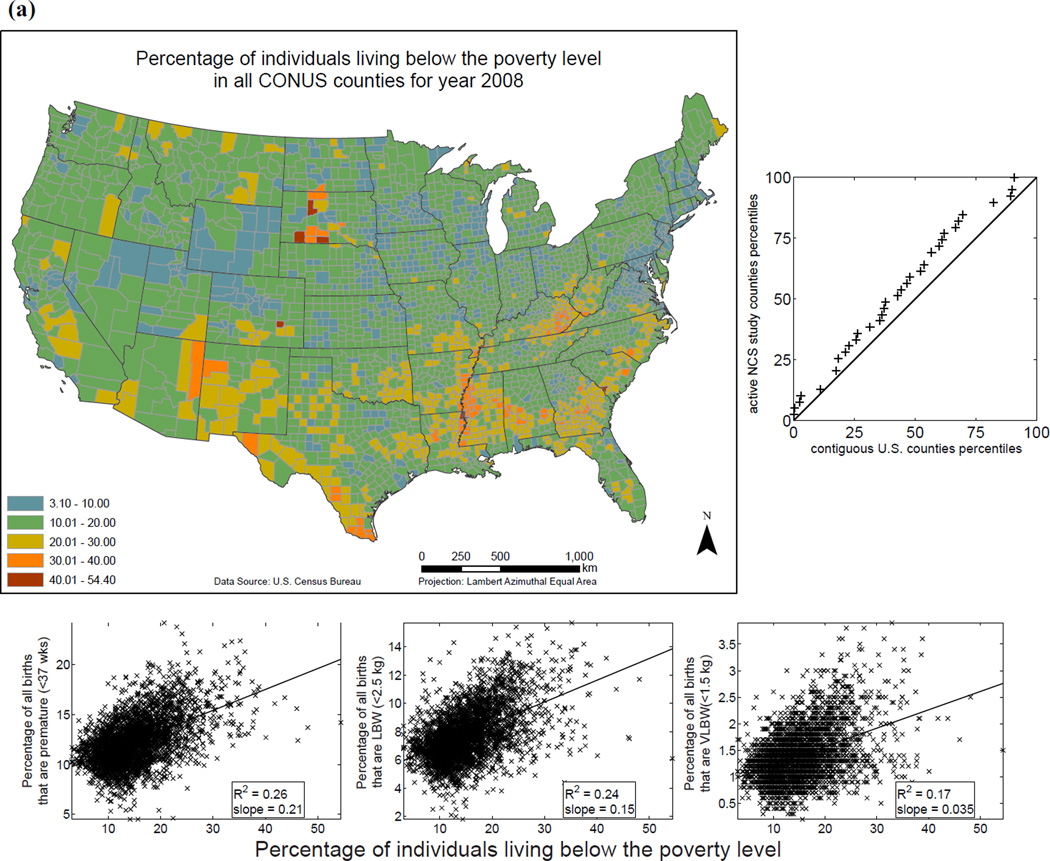
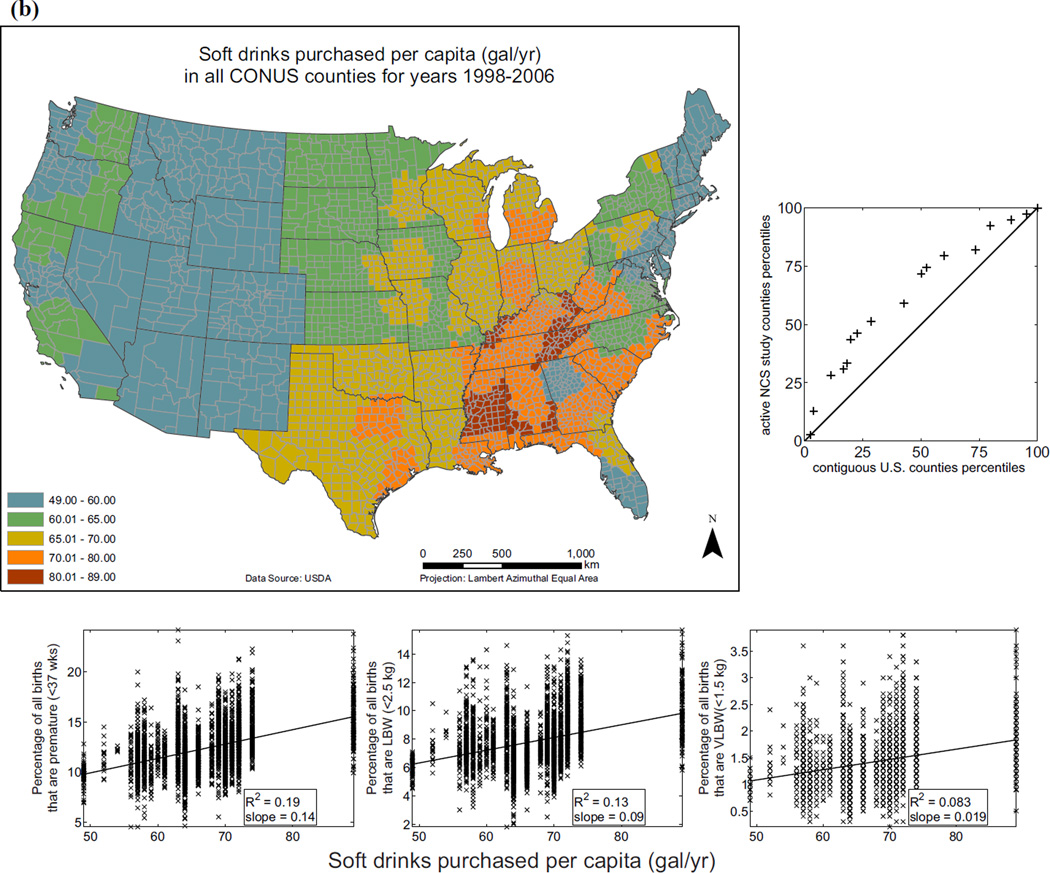
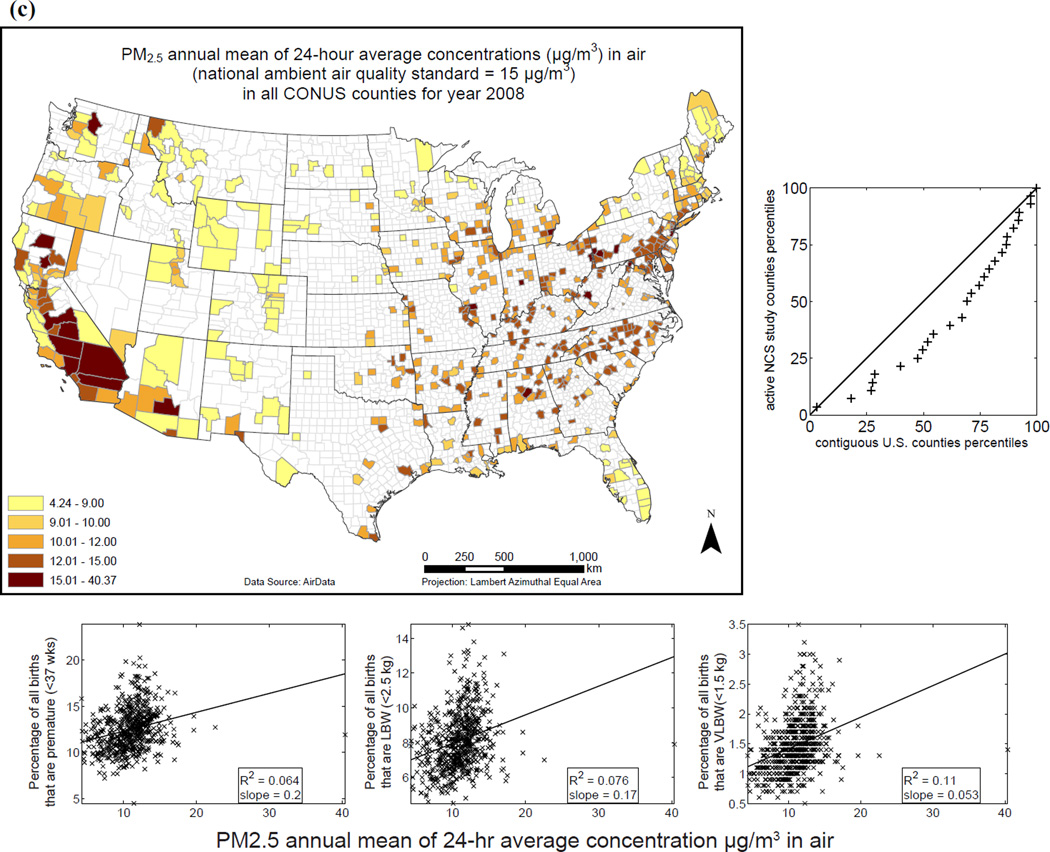
Fig. 6.
Examples of exposure-relevant factors included in EXIS: (a) County-level map showing percentage of individuals living below the poverty level for 2008 in the CONUS.(31,34) (b) County-level map showing soft drinks purchased per capita in the CONUS.(31,35) (c) Annual average of ambient PM2.5 levels observed in the CONUS in 2008.(31,36) To the right of each map is a QQ plot: the proximity of distribution quantile points to the 45°; line as a measure of the similarity of the two distributions. Under each map are scatterplots showing linear (ordinary least squares) regression and logistic regression versus the selected endpoints of preterm birth (PB), low birth weight (LBW), and very low birth weight (VLBW).


