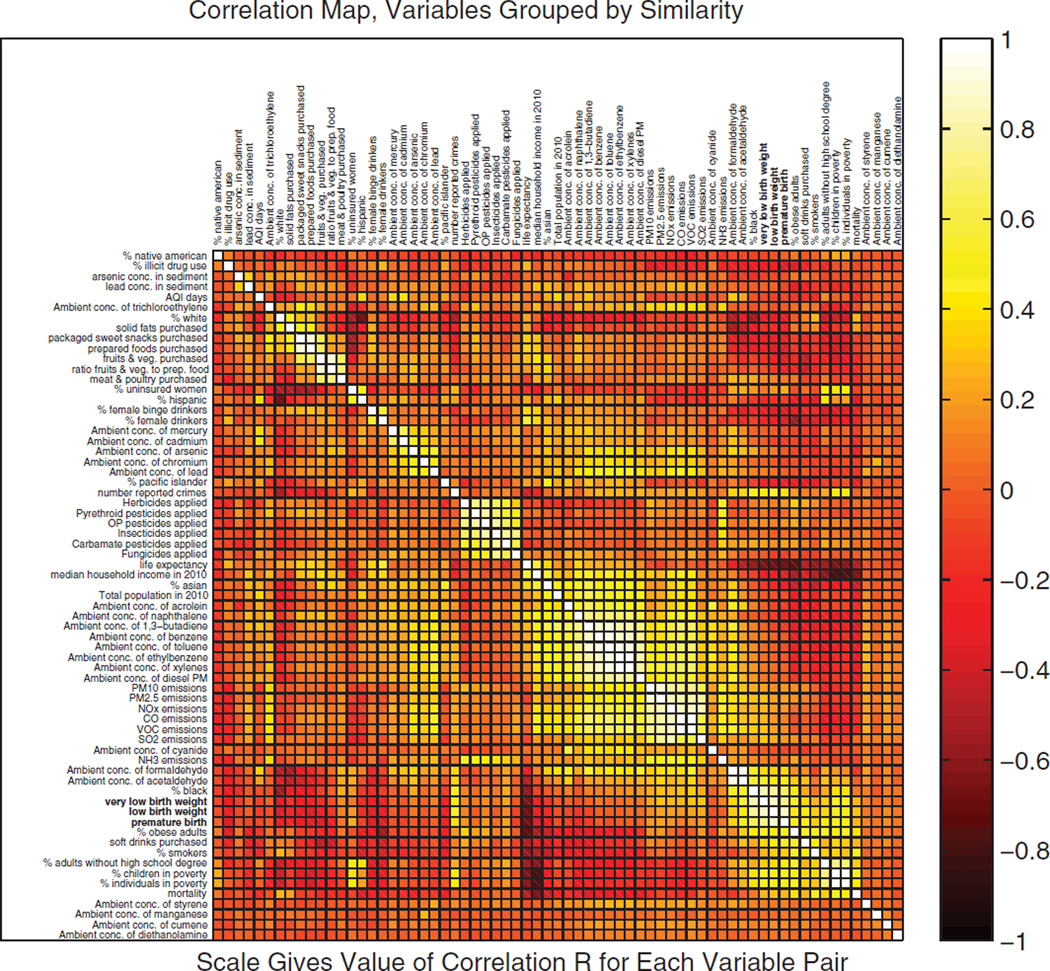
Fig. 8.
Exploratory multivariate analysis of exposure-relevant factors (included in EXIS) with respect to selected birth outcomes: the correlation map is a visual representation of the linear dependence between pairs of variables (which are grouped here by similarity). The analysis has been performed with county-level data for the CONUS.

