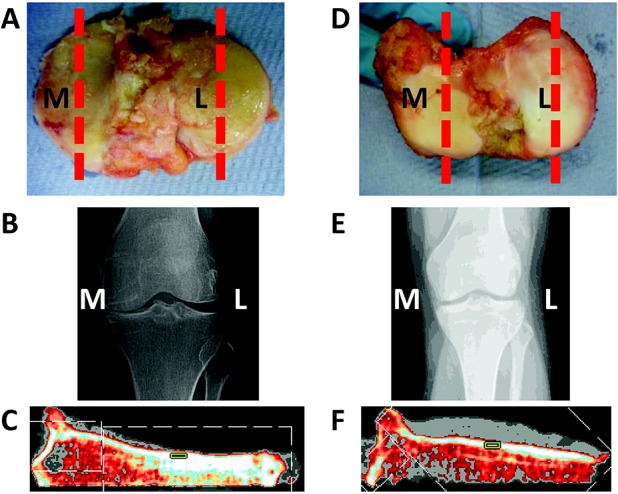
Figure 1.

Assessment of the tibial plateau from a patient with osteoarthritis (OA) compared to that from a non-OA control. Postoperative photographs (A and D) and preoperative radiographs (B and E) of the medial (M) and lateral (L) tibial plateaus from a representative patient with OA (A and B) and a non-OA control (D and E) are shown. The medial tibial plateau (C) and lateral tibial plateau (F) from a patient with OA were assessed by peripheral quantitative computed tomography (pQCT). In the pQCT images, the region of interest is demarcated as a green box. The red broken lines in A and D indicate the plane from which the pQCT measurements were obtained.
