Figure 5.

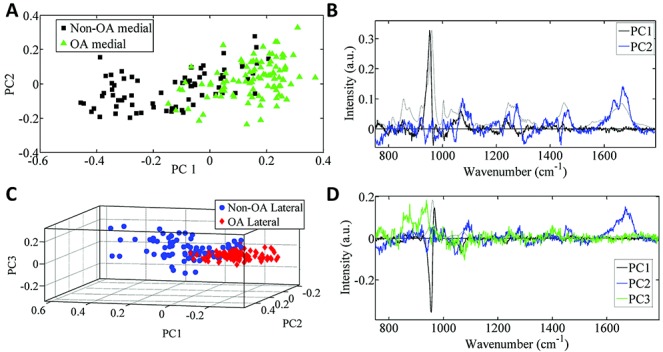
Principal components analysis (PCA) showing the plot of PCA scores for the non-osteoarthritis (non-OA) and OA medial compartment (A) and the corresponding loadings plot (B), as well as the plot of PCA scores for the non-OA and OA lateral compartment (C) and the corresponding loadings plot (D).
