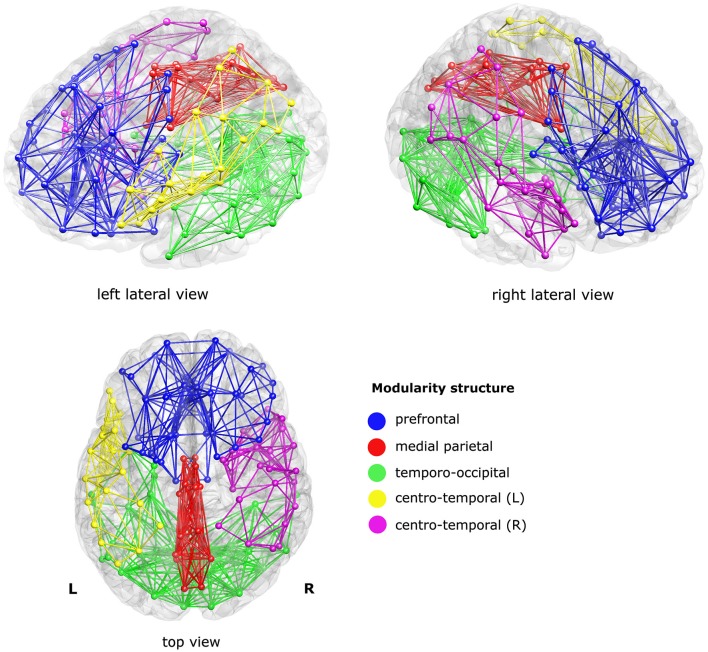
Figure 2.
Sub-networks as derived from a modularity analysis of the mean structural connectivity (SC) network of the controls. Five sub-networks (i.e., modules) were found; a prefrontal cluster (blue), a medial parietal cluster (red), an inferior temporo-occipital cluster (green), and a left and a right centro-temporal cluster (yellow and magenta, respectively). For visualization purposes, only the within-module connections were visualized, at sparsity level 0.1.

