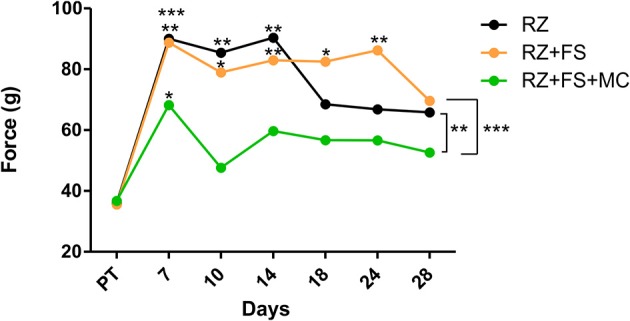
Figure 3.

Electronic von-Frey measurements (average values) obtained from the right hind paw (lesioned). The values are shown in grams (g) applied to trigger the “flinch” response. Statistical differences among groups are indicated with brackets. Asterisks above each dot represent the comparison between the time point and the respective pre-test. FS, fibrin sealant; PT, pretest; MC, mononuclear cells; RZ, rhizotomy.
