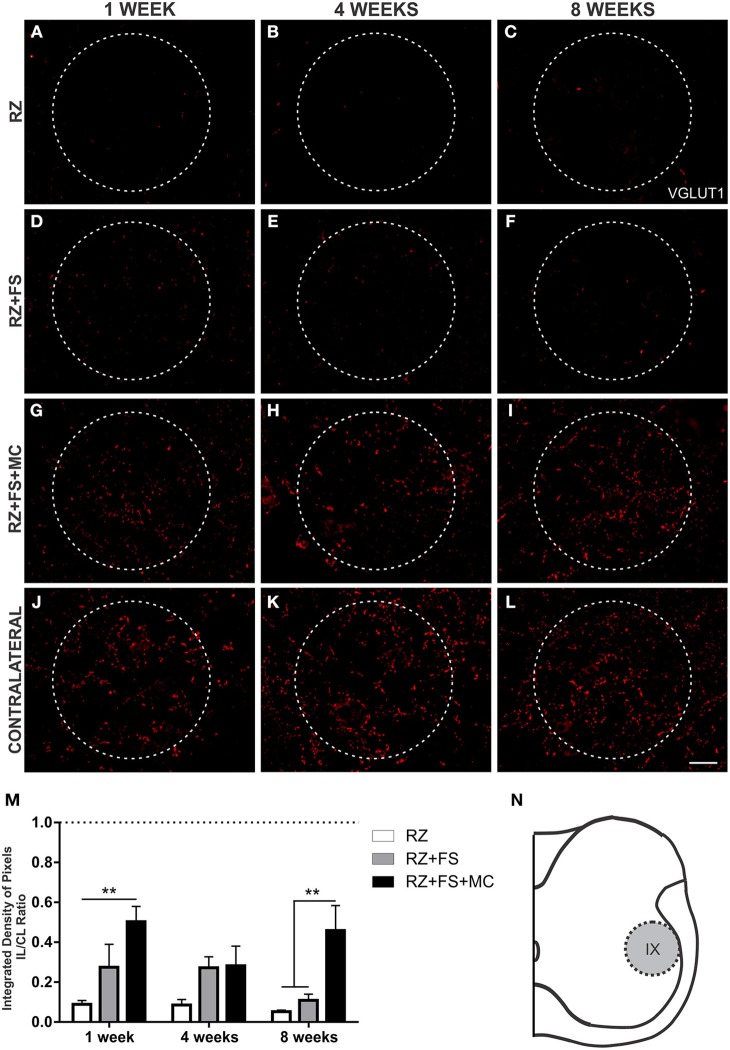
Figure 9.
Immunohistochemistry for vesicular glutamate transporter 1 (VGLUT1). (A–L) Representative images of RZ, RZ+FS and RZ+FS+MC, 1, 4, and 8 weeks post lesion. (M) Quantification (ratio IL/CL) of the integrated density of pixels, obtained in the region delimited by dashed circles. (N) Representation of lamina IX (total quantification area 8.5 × 105 μm2). CL, contralateral; FS, fibrin sealant; IL, ispsilateral; MC, mononuclear cells; RZ, rhizotomy. Scale bar = 50 μm. **p < 0.01.

