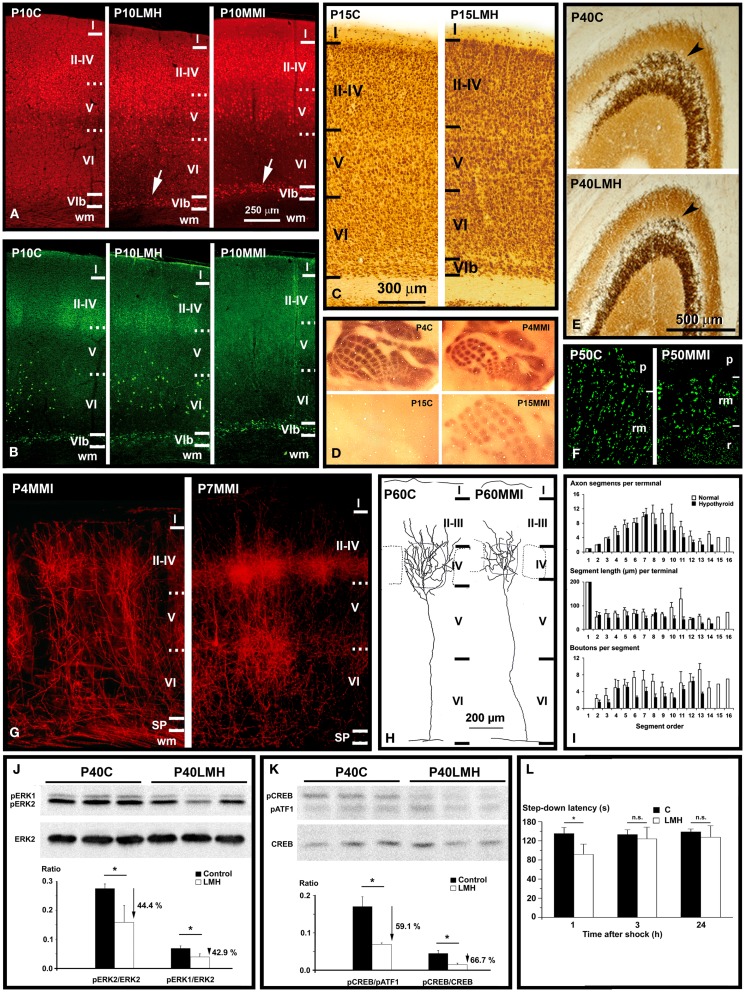
Figure 3.
Thyroid hormones affect connectivity, maturation, and function of the cerebral cortex. (A,B) Collages from confocal photo- micrographs (taken with the ×20 objective) showing double immunolabeling for Camk4 [red; (A)] and Nurr1 [green; (B)] in the parietal cortex of P10 control (C), LMH (pups born to dams thyroidectomized at E16), and MMI (MMI treatment starting at E10) pups. Most of Camk4-immunoreactive neurons were located in layers II–IV and upper layer V. Numerous Camk4-immunoreactive neurons can be seen in layer VIb of P10LMH and P10MMI pups (arrows) compared with P10C pups. At P10, about 60% of Camk4-immunoreactive neurons of layer VIb are also Nurr1-immunoreactive. (C) Photomicrographs of coronal sections of the parietal cortex showing NeuN-immunoreactive neurons in C and LMH pups at P15. At P15, the border between the subplate and adjacent layer VI is more clear-cut in LMH than in C pups, showing that a remaining subplate is still present. (D) Photomicrographs of flattened neocortex tangential sections showing 5-HT immunostaining in the posteromedial barrel subfield of the parietal cortex of C and MMI rats at P4 and P15. At P4, heavily immunostained barrels can be seen. Decay of 5-HT labeling occurs by P11 in C and by P16 in MMI rats. Note that in P15C rats, no barrels were immunostained, whereas in P15MMI rats, they are still immunopositive. (E) Photomicrographs of coronal sections of the area CA3 of the hippocampus showing the Zn-labeling of mossy fibers in C and LMH pups at P40. Note the heavier labeling of mossy fibers in the stratum oriens (arrowhead) of CA3 in C compared with LMH pups. (F) Confocal deconvoluted images of vesicular glutamate transporter type 1 (VGluT1, which labels excitatory buttons) of the stratum radiatum (rm) in CA3 in C and MMI rats at P50, labeling mossy fiber buttons. Note the decreased density of immunoreactive buttons in P50MMI pups compared to controls. (G) Photomicrographs of coronal sections from P4 and P7 MMI rats that had the lipophilic carbocyanine DiI tracer (1,1′-dioctadecyl-3,3,3′,3′- tetramethylindocarbocyanine perchlorate) implanted in the ventro-basal thalamic nucleus. At P4, DiI-labeled thalamic afferents enter the somatosensory cortex, and form clusters in layer IV. At P7, collaterals in layer IV form more dense clusters than at P4. These images show that hypothyroid thalamic axons reach their somatosensory target areas as in normal rats. (H) Coronal views of thalamocortical terminal arbors in layer IV in the posteromedial barrel subfield of C and MMI rats at P60. The barrel limit is marked with dashed lines. Note that in MMI rats terminal arbors have shorter and tortuous branches. (I) Histograms representing mean values for the number of axon segments per terminal (upper), segment length (middle), and buttons per segment (bottom) in C (white bars) and MMI (black bars) rats for each segment order. Note that in general MMI mean values are lower. (J,K) Western blots obtained from the hippocampus of C and LMH pups at P40, immunolabeled for ERK2, pERK1, and pERK2 (J) and pATF1, pCREB, and CREB (K). Histograms showing that the pERK1/ERK2 and pERK2/ERK2 (J) and pCREB/pATF1 and pCREB/CREB (K) ratios are reduced by 44.4, 42.9, 59.1, and 66.7%, respectively, in LMH compared with C pups. (L) Histogram showing step-down latencies in seconds at 1, 3, and 24 h after the initial foot shock in C and LMH pups at P39. Pups from LMH dams show 24.9% reduction in the step-down latency at 1 h after the foot shock. (J–L) Error bars represent ± SD; n.s., no significant differences; *P < 0.001 for LMH compared with C group. (A,B) Modified from Navarro et al. (239). (C,E,J,K,L) Modified from Berbel et al. (169). (D,G,H,I) Modified from Ausó et al. (246).

