
Figure 1.
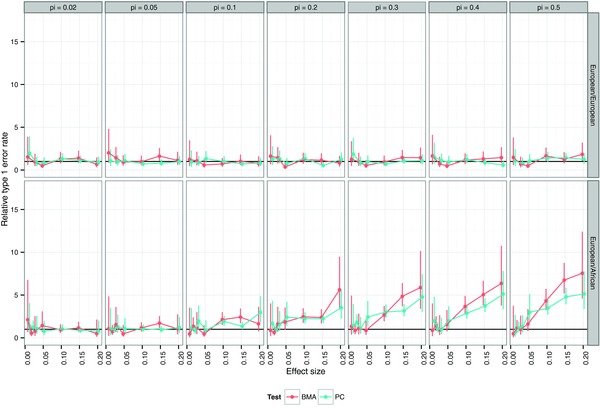
Type 1 error rates in naive colocalisation testing. A nominal type 1 error rate of 5%, shown by a dashed line, is consistently exceeded using conditional colocalisation testing conditioning on either the most associated SNP for the other trait (C1) or the common causal SNP that is only possible in simulated complete genotyping data (C2). Proportional colocalisation testing tends to exhibit lower type 1 error rates, but the excess can still be substantial when using the most strongly associated SNPs in each dataset (P1); the union of lasso variable selection in each dataset (P2) or a two stage lasso variable selection (P3) as previously described [Wallace et al., 2012]. In contrast , type 1 error rates are well controlled for proportional testing using principle components that capture 85% of the genetic variation (P4) or within a Bayesian Model Averaging approach to variable selection (P5), even appearing conservative for small effect sizes. Note that Bayesian Model Averaging was not examined in the complete genotyping scenario due to computational burden. The X axis shows the relative risk of disease (RR) with columns divided according to the number of cases and controls in a case‐control dataset. Type 1 error rates were calculated by comparing two case‐control datasets of equal sample and effect size, simulated to share a common causal variant.