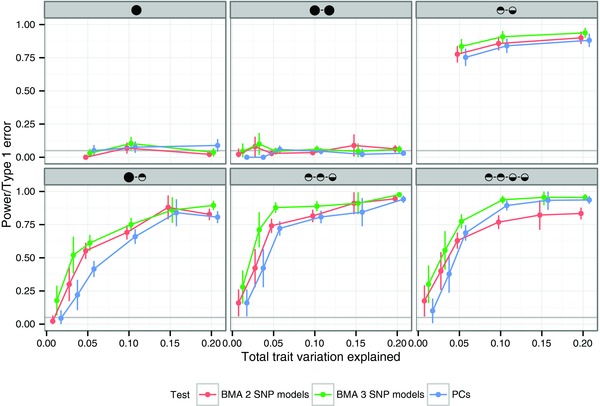
Figure 3.

Departure from assumption of equal LD structure. Each plot reflects simulations in which a single, common causal variant explains a fixed proportion of variance of two quantitative traits, shown on the x axis, each available in a sample of 1,000 individuals. In the top row, all haplotypes in the first dataset and of the haplotypes in the second dataset were sampled from the European CEU, GBR and FIN populations, with the remaining π in the second dataset from the alternate European TSI and IBS populations. In the bottom row, we used the same strategy but sampling either from all European populations (CEU, GBR, FIN, TSI and IBS) or from a mixture of these European populations and the African ASW, LWK and YRI populations. The y axis shows the relative type 1 error rate—the ratio of the estimated rate for the given scenario and the estimated rate for the equivalent scenario with no mixing. Because these are ratios, there is rather less certainty than for other plots and 95% confidence intervals calculated by means of the delta method are shown for each point. Analysis was conducted by proportional testing using either a PC approach with number of principal components selected to capture 90% of genetic variation or a BMA approach, averaging over the space of either all possible two SNP models. We considered only tagging genotype scenarios. CEU=Utah Residents (CEPH) with Northern and Western European ancestry; GBR = British in England and Scotland; FIN = Finnish in Finland; TSI = Toscani in Italia; IBS = Iberian population in Spain; ASW = Americans of African Ancestry in SW USA; LWK = Luhya in Webuye, Kenya; YRI = Yoruba in Ibadan, Nigeria.
