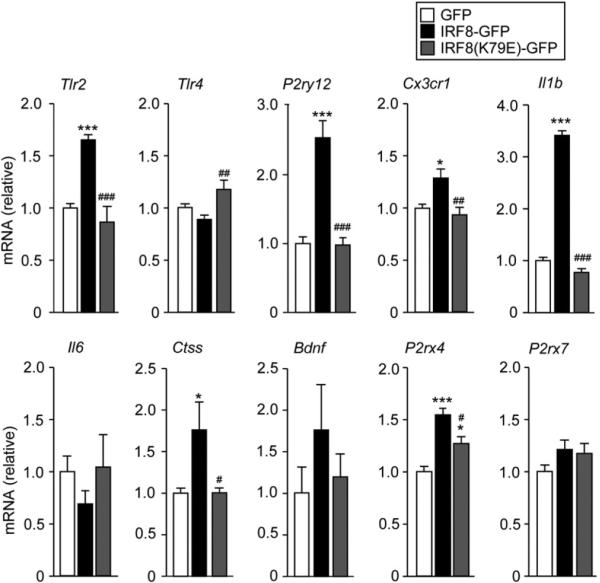
Figure 2. Forced Expression of IRF8 in Microglia Promotes Gene Transcription.
Real-time PCR analysis of the mRNA of genes of interest in cultured microglia 72 hr after transduction. Values represent the relative ratio of mRNA (of tested genes, normalized to Gapdh mRNA) to control microglia with GFP alone (n = 5–7, *p < 0.05, ***p < 0.001 versus GFP; #p < 0.05, ##p < 0.01, ###p < 0.001 versus IRF8-GFP).
Values are the mean ± SEM for all groups.
See also Figure S2.

