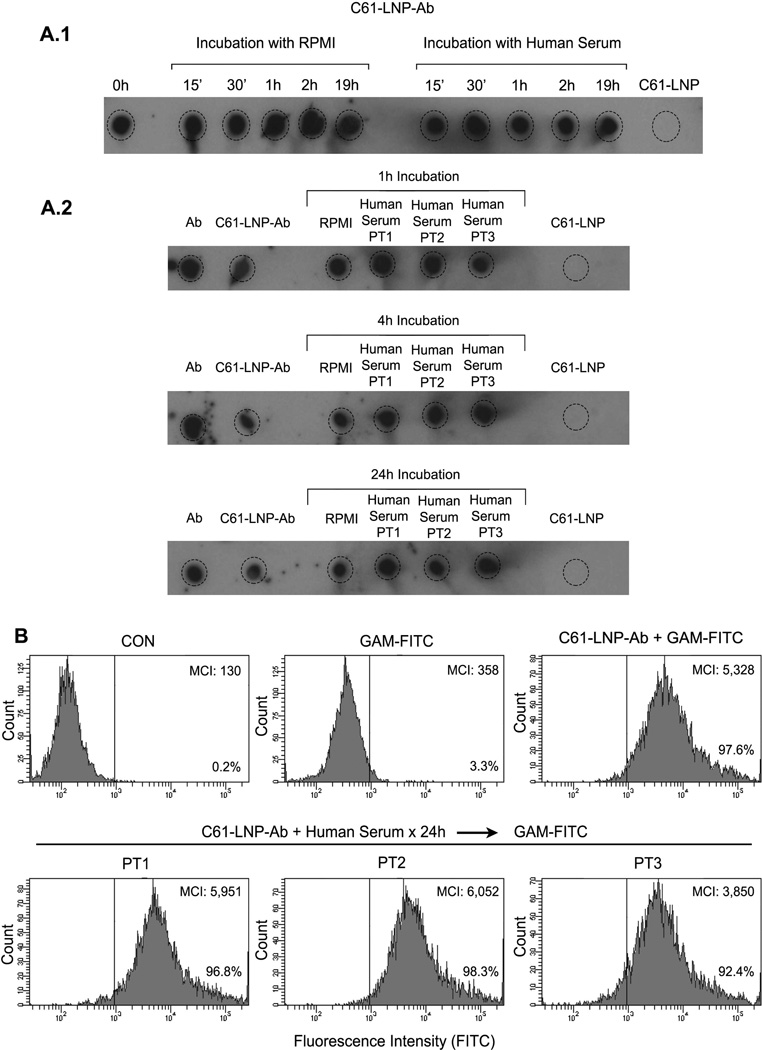
Figure 3. Stability of C61-LNP-Ab in the Presence of Human Serum.
C61-LNP-Ab was incubated for indicated time periods ranging from 15 min to 24 h with serum obtained from primary bone marrow aspirate samples of 3 pediatric B-precursor ALL patients (PT1, PT2, PT3) at a 1:1 volume: volume ratio. Subsequently, dot plot analysis of 2 µL aliquots was performed on PVDF membranes using a polyclonal goat anti-mouse IgG-HRP. Likewise, a flow cytometric immunoreactivity analysis with the B-precursor ALL cell line ALL-1 using the FITC-labeled GAM antibody was performed. Control samples were incubated with serum-free RPMI tissue culture medium instead of human serum. The immunoreactive dots were visualized by chemiluminescence, as described in Materials and Methods. A.1 depicts the dot blots of the C61-LNP-Ab samples that were incubated with serum from PT1 for 15 min-19 h. A.2 depicts the dot blots of the C61-LNP-Ab samples that were incubated with serum from PT1, PT-2, or PT3 for 1h, 4h, or 24h. Untreated free Ab served as a positive control whereas C61-LNP served as a negative control. B. depicts in the upper row the FACS histograms of the B-precursor ALL cell line ALL-1 stained for 1 h on ice with GAM-FITC alone or C61-LNP-Ab (200 µg/mL based on C61 content) followed by GAM-FITC. Control ALL-1 cells (CON) were left unstained. Depicted in the bottom row are the FACS histograms of ALL-1 cells stained with C61-LNP-Ab that was preincubated for 24h with human serum from PT1, PT2, or PT3. MCI: median channel of immunofluorescence. The percentage of cells displaying above background fluorescence is indicated for each sample.

