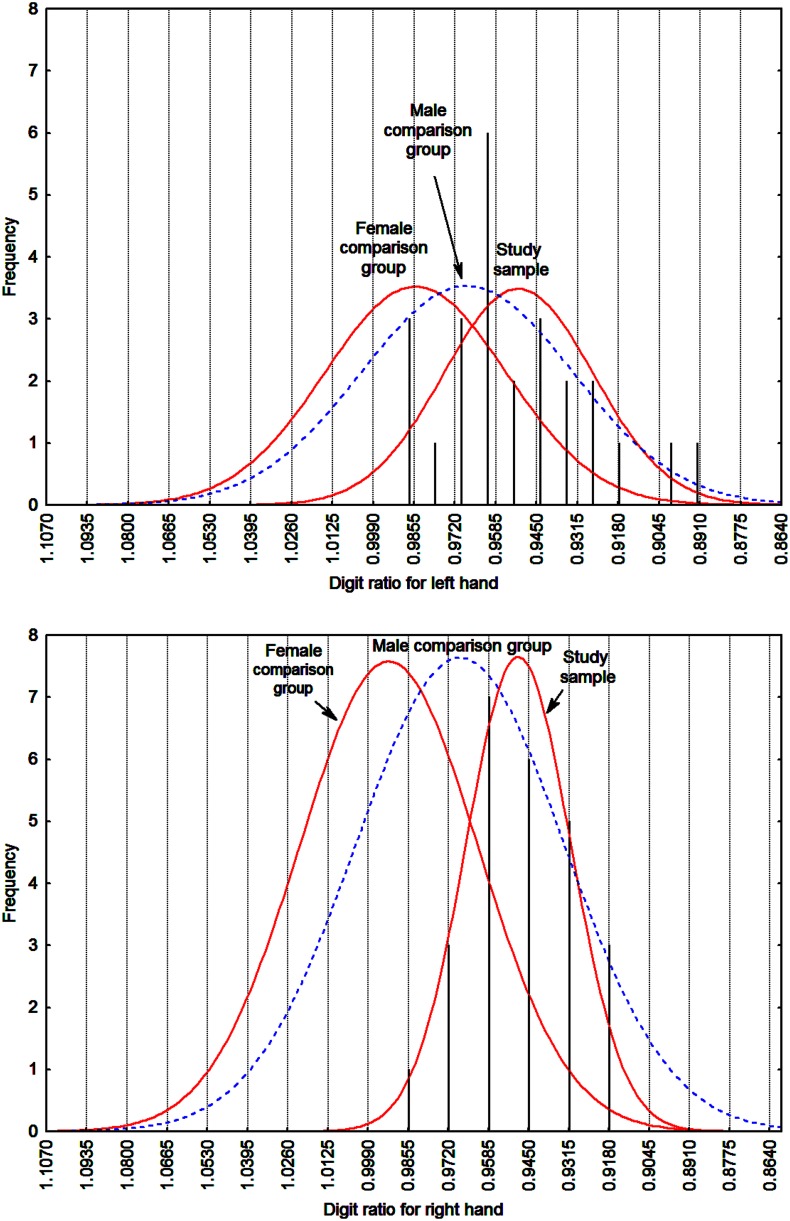
FIGURE 1.
Histograms of 2D:4D for the left and right hand with fitted continuous Gaussian functions for study sample and both female and male comparison samples (Troche et al., 2007). Note that the comparison sample functions are scaled to the study sample and are thus unrelated to absolute frequency.

