
Figure 2.
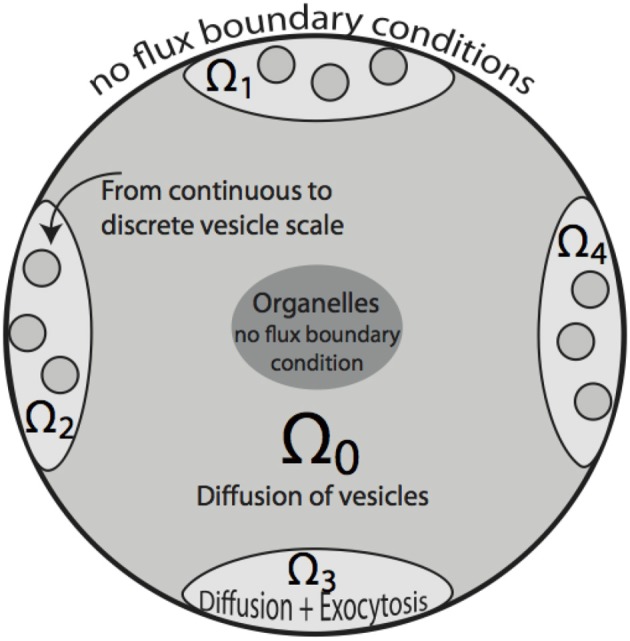
Two-dimensional sketch of the bouton model. Region Ω0 denotes the bouton area in which vesicle motion is governed by diffusion. A cutout region in the center represents space occupied by organelles, such as mitochondria. Ω1 … Ω4 define synaptic active zones. In these subdomains, vesicles diffuse and are subject to exocytosis modeled by the term fsyn, that also includes the transition from the continuous to discrete scale in Ω1 … Ω4. The organelle as well as bouton boundaries are treated as no-flux boundary conditions.